


Introduction
Over the past years, the author of this article published several papers which dealt with patterns and dynamics of egg trade and production. As FAO for several years did not publish new data on egg trade, an update of the 2013 data was not possible.
In 2018, FAO closed the gap between 2013 and 2016 and published a new complete set of data at country and continent level. This made it possible to prepare a new publication dealing with the dynamics and changing spatial patterns of egg trade covering the decade between 2006 and 2016.
The report has four parts. In Part 1, a general overview on the development of egg production and egg trade will be given. In Part 2, egg exports and imports at continent and country level will be analysed in detail. Part 3 presents the dynamics of egg trade at the level of Country Development Groups. This model was used in several other publications and it gives a good impression of the roles which the developing, threshold and old industrialised countries played in egg exports and imports. In Part 4, selected case studies of trade flows will be presented and analysed. This is of particular interest for the understanding of the spatial patterns in egg trade.
The main objectives of the four papers are:
- to document and analyze the development of egg exports and imports between 2006 and 2016 at continent and country level;
- to analyze the role of developing, threshold and old industrialised countries in global egg trade;
- to document and analyze the trade flows of several egg exporting and egg importing countries with the aim to better understand the specific spatial patterns in global egg trade.
A general overview
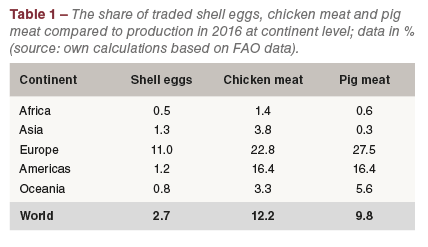
Because of this limiting factor, most of the produced eggs are used domestically. A comparatively small amount of shell eggs is traded in comparison to chicken and pig meat (Table 1). Shell eggs are mainly traded in Europe, chicken and pig meat in Europe and the Americas.


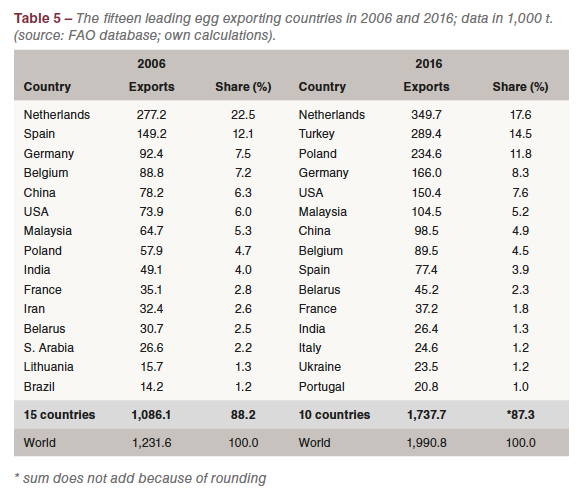
In Table 5, the fifteen leading egg exporting countries in 2006 and 2016 are listed. In 2006, they contributed 1.11 mill. t or 88.2% to the global export volume. Eight of the countries were located in Europe, with the Netherlands in an absolute dominating position, sharing 22.5 of the exports, followed by Spain (12.1%) and Germany (7.5%).
In 2016, the composition and the ranking had changed considerably. The Netherlands still ranked in first place but had lost 4.9% of their former share. Turkey which ranked as number 17 in 2006 with an export volume of less than 12,000 t, jumped to second place in 2016, exporting 289,400 t, about 277,000 t more than ten years ago. Poland could also expand its exports considerably, ranking in third place, followed by Germany, the USA and Malaysia. While the USA was able to double its export volume, India lost almost half of its exports. The USA could increase their egg production considerably, in India demand grew much faster than production.
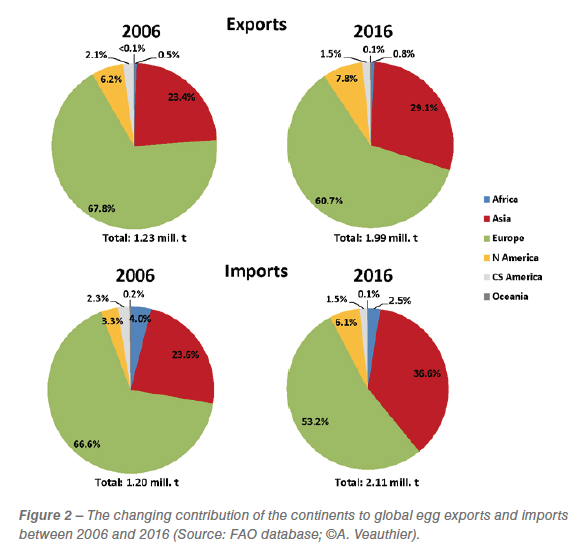


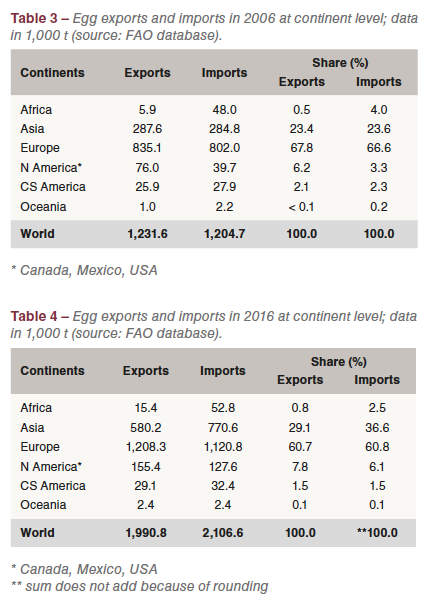
Between 2006 and 2016, the global import volume grew by 899,000 t or 74.4%. Germany was still the leading egg importing country with 440,800 t or a share of 20.9%. Despite an increase of 134,000 t, it lost 4.5% of its former share. In second and third place ranked Iraq and the Netherlands. High absolute growth rates also showed Hong Kong, Singapore, the Russian Federation and the United Arab Emirates. The remarkable increase of Iraq’s egg imports is an aftermath of the Iraq war which almost completely destroyed the domestic egg industry. The high egg imports of the Netherlands are a result of increased exports to the USA because of the Avian Influenza outbreaks in the Midwest in 2015. Dutch egg farmers who own farms in Eastern Germany send their eggs to the Netherlands. They are counted as “imports” for the Netherlands and “exports” for Germany, even though they may then be re-exported to Germany or further processed and then exported as liquid or dried eggs. Both tables document the leading roles of Europe and Asia in world egg trade.


References
Windhorst, H.-W.: Regional Patterns of European Egg Production and Trade – with Special Reference to the EU. London: International Egg Commission 2010.
Windhorst, H.-W.: The Globalization of Egg Production and Trade. London: International Egg Commission 2013.
Windhorst, H.-W.: The EU Egg Industry in Transition. London: International Egg Commission April 2017a.
Windhorst, H.-W.: The North American Egg Industry in Transition. London: International Egg Commission 2018a.
Windhorst, H.-W.: A projection of the future dynamics in global egg production. In: Zootecnica International 40 (2018b), no. 7/8, p. 24-26.
FAO database: http://www.fao.org/faostat
*The papers are an abridged version of a Special Report which the author prepared for the IEC Business Conference in Monte Carlo in April 2019.


