


The fourth part of the series will present patterns of trade flows for some of the leading egg exporting and importing countries.
The Dutch-German trade cluster
A first case study will deal with the egg exports and imports of the Netherlands and Germany. Between these two countries a close exchange of eggs has developed. The Netherlands have been the leading egg exporting country and Germany the leading egg importing country for several decades. The close market relations developed because of the direct neighborhood of the main egg producing provinces in the Netherlands and the population agglomerations along the river Rhine in Germany. Over the years, egg trade between the two countries reached volumes which do not have a parallel worldwide


Figure 6 documents the considerable fluctuations of the Dutch egg exports and the German egg imports. The ups and down have various reasons. Several outbreaks of the Avian Influenza virus (2003, 2017) which resulted in import bans had considerable impacts on egg exports by the Netherlands. The banning of conventional cages in Germany as early as 2010 resulted in a sharp increase of German’s imports from the Netherlands. When the transformation to alternative housing systems was completed, imports decreased again. Because of the growing per capita consumption Germany had to raise its imports again from 2012 on.
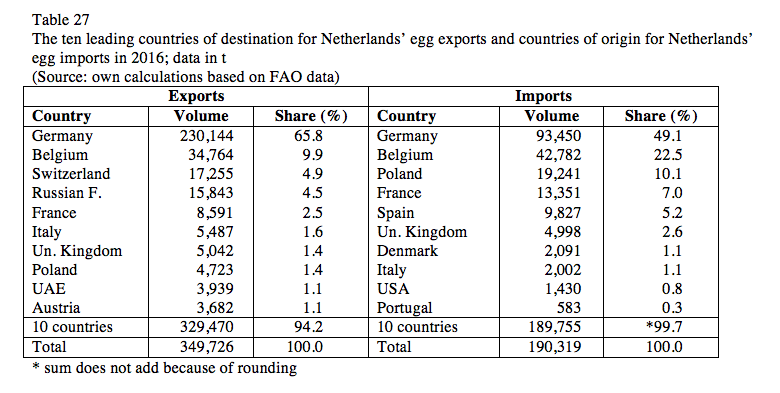
In Table 27, the Dutch egg exports and egg imports for 2016 are listed by country. Of the total export volume 65.8% were directed to Germany, followed by Belgium, Switzerland and the Russian Federation. With a share of 49.1% Germany was also the leading country of origin for egg imports, followed by Belgium and Poland. The composition of the leading countries of destination for the exports and countries of origin for the imports show the focus on European countries, mainly EU member countries. Exports to countries outside Europe were only of minor importance. An exception was the year 2015 when over 5,200 t of eggs for further processing were exported to the USA. Because of the disastrous impacts of the AI outbreaks in the Midwest in 2015, U.S. egg processors had to import eggs to fulfil their contracts for egg products.
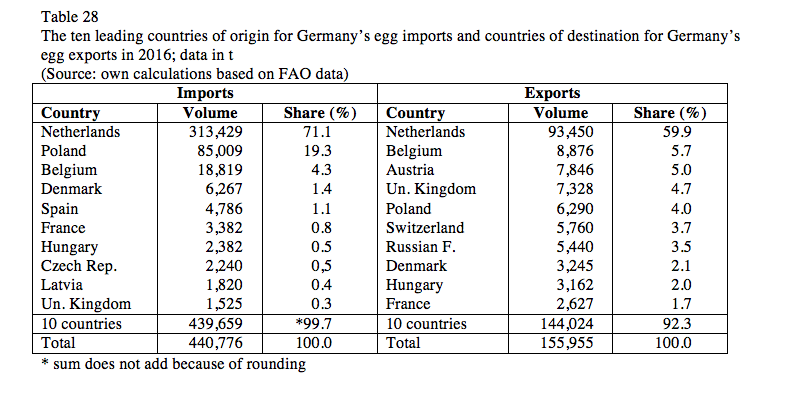
The close bilateral trade relations between the Netherlands and Germany are also documented in Table 28 and Figure 7. In 2016, 71.1% of Germany´s egg imports came from the Netherlands and 59.9% of the egg exports were directed to the Netherlands. Poland gained considerable market shares over the past years and it is expected that imports will further increase. The German trade relations were focused on EU member countries. Eggs were not imported from non-EU countries. In 2016, only Switzerland and the Russian Federation were countries of destination for egg exports, but because of the Russian import ban on agricultural products from the EU, from 2017 on exports to the Russian Federation were no longer possible.


The Malaysia – Singapore trade cluster
A similar trade cluster developed in Asia between Malaysia and Singapore. Figure 8 and Tables 29 and 30 document the close interdependence between Malaysia’s exports and Singapore’s imports


Two very successful newcomers in global egg trade
In Part 1 it could be shown that besides the Netherlands two newcomers, Turkey and Poland, gained considerable shares in global egg exports (see Table 5). Together they contributed 26.3% to global egg exports in 2016.
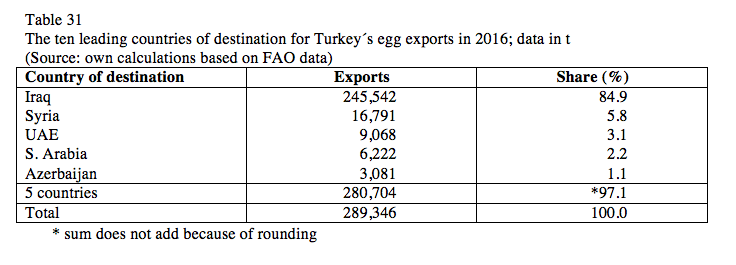
Table 31 documents that the Turkish egg industry profited from the collapse of the egg industries in Iraq and Syria resulting from the military conflicts. Over 90% of the egg exports went to these two countries. Other countries of destination were located in Western and Central Asia and in Africa. But with the exception of Saudi Arabia and the United Arab Emirates exports to these countries were only of minor importance. It is obvious that Islamic countries were the main markets. The trade flows of Turkey’s egg exports are shown in Figure 9.


In contrast to Turkey, Poland exported eggs to 49 countries. The exports were mainly directed to EU member countries. The five leading countries of destination were all members of the EU (Table 32). Together they shared 73.0% of the total export volume, the three leading countries alone 59.2%. Figure 10 documents the completely different trade flow patterns of the two countries. It is obvious that they did not compete with each other in the global egg market.


Wide trade nets – USA and Hong Kong
In a third case study, the trade patterns of U.S. egg exports and Hong Kong’s egg imports will be analysed. They are specific because of their almost global trade relations.


In Figure 13 the development of egg exports of the USA and Hong Kong’s egg imports between 2006 and 2016 are documented. U.S. egg exports increased by 76,428 t or 103.4%. A peak was reached with over 183,000 t in 2014. Because of the impacts of the AI outbreaks in 2015, exports decreased in 2015 and 2016. To fulfil their contracts, egg processing companies had to import shell eggs for further processing. Between 2014 and 2015 imports increased from 10,350 t to almost 55,000 t. Shell eggs were mainly imported from the two NAFTA member countries and the EU.
Hong Kong’s egg imports grew by 66,081 t or 78.7% in the analysed decade. From 2014 on imports increased much faster than in the preceding years, obviously a result of a higher consumption as the domestic production remained at the same level.

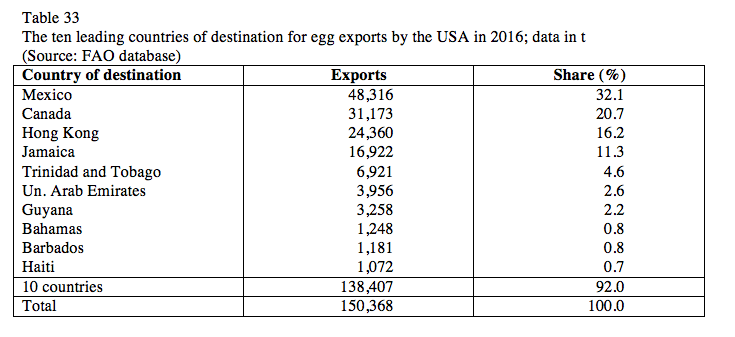
In 2016, the USA exported eggs to 78 countries. Only Poland had a similar wide trade net. Despite the large number of countries, the ten leading countries of destination shared 92.0% in the total export volume, the two NAFTA member countries alone 42.8% (Table 33). A detailed analysis of all countries would show that exports focused on East and Western Asia, Central America and some African countries.


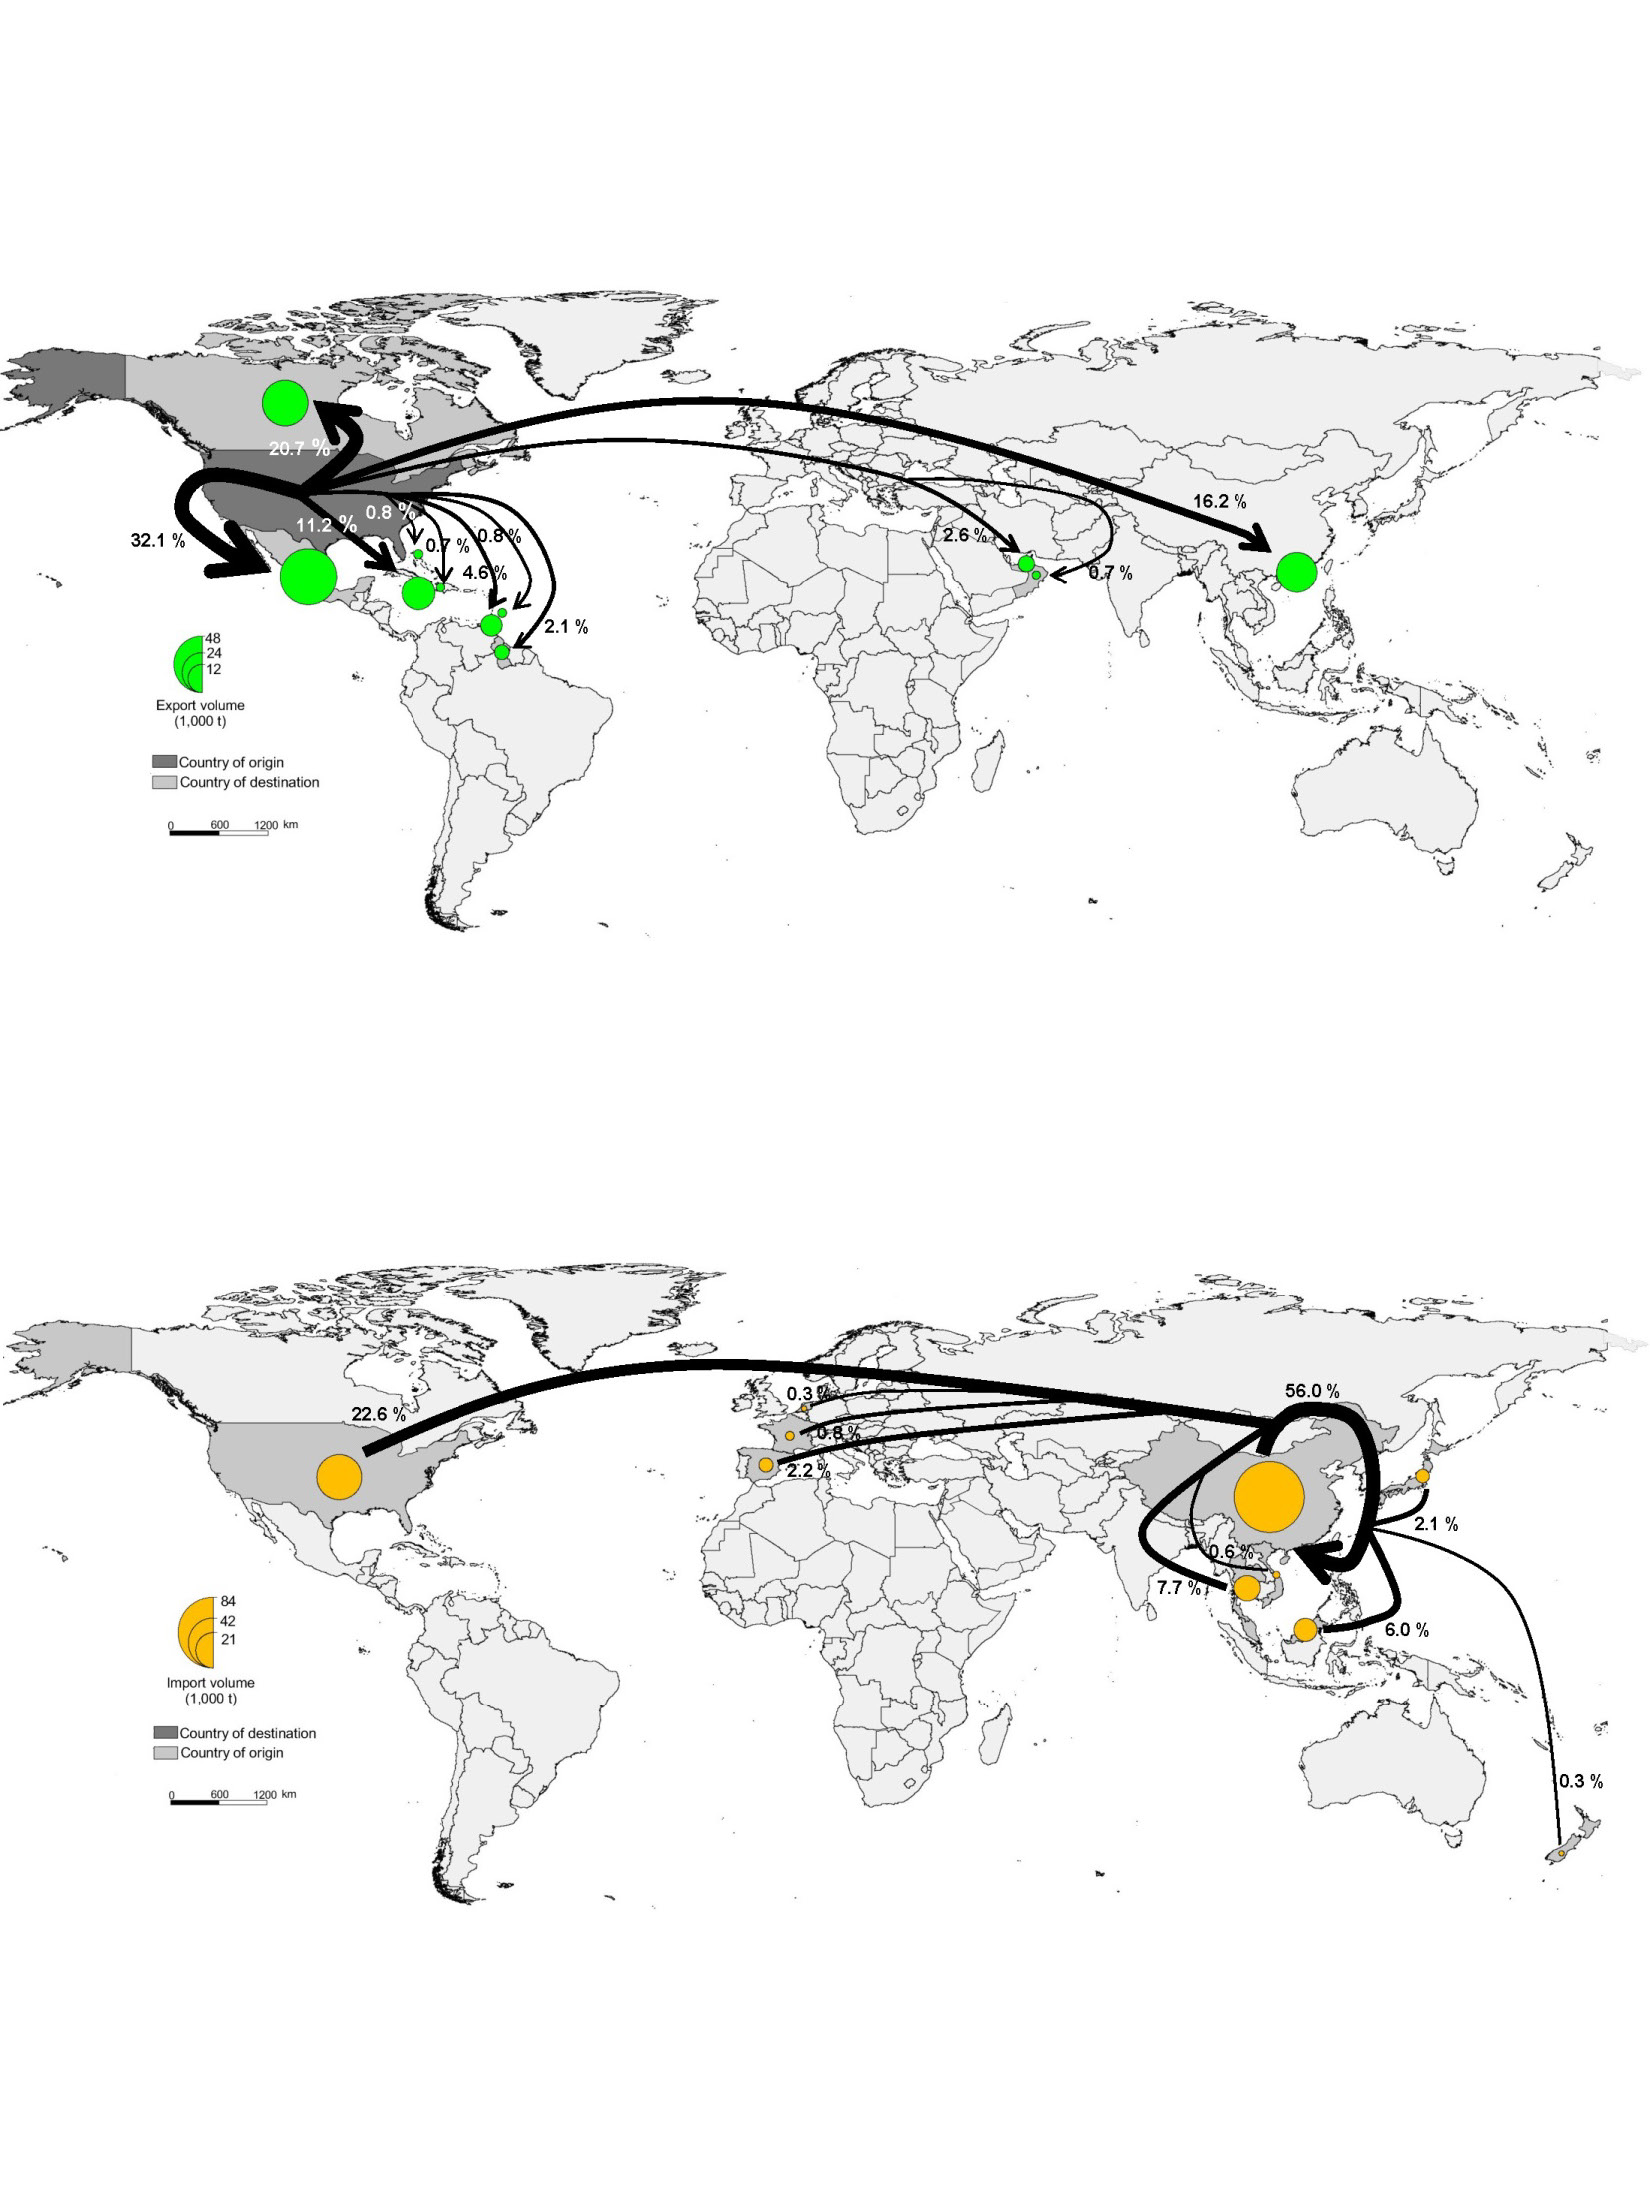
Hong Kong imported eggs from 27 countries in 2016, only Germany and the Netherlands had similar wide trade relations. Despite the remarkable large number of countries of origin, the ten leading countries contributed 98.7% to the total import volume (Table 34), China and the USA together 78.6%. The dominance of China with 56.0% was to be expected. Figure 11 documents the trade flows of the two countries to their main trade partners.

The main results of Part 4 are as follows:
- Global egg trade flows in 2016 showed various spatial patterns, reaching from narrow clusters to global nets.
- Two major trade clusters developed over the past two decades. The trade relations between the Netherlands and Germany are of particular importance because of the high trade volumes.
- The cluster which developed between Malaysia and Singapore is younger and the traded volumes are smaller. The bilateral dependence of the two countries was, however, even higher than that between the Netherlands and Germany.
- The extraordinary fast increase of egg exports by Turkey and Poland was possible because of the high efficiency of the egg industry in these countries and the completely different spatial patterns of their trade flows which avoided any competition in the global egg market.
- Although the USA and Hong Kong traded eggs with a large number of countries and the trade net has a global dimension, only a few countries share the majority of exports respectively imports.
- All three trade patterns which are presented in Part 3 strengthen the statement that eggs are mainly traded over comparatively short distances because of the inability to transport them deep-frozen.
Perspectives
The preceding analysis of the dynamics and patterns of global egg trade between 2006 and 2016 could showthat the trade volumes grew much faster than production.This indicates that the egg demand in many countries grew faster than their domestic production. On the other hand, countries were able to generate a surplus over their own demand because of highly efficient production systems.
It can be expected that the volume of traded eggs will also in future grow faster than production. The increasing demand in several developing countries cannot be met by their domestic production. Political and economic instability, military conflicts, the lack of capital and know how as well as limited feed resources are the main limiting factors. This is a chance for the OIC and some NIC to develop markets for their surplus. A growth of egg trade is a good way to supply a growing population in the developing countries with the valuable egg protein. Nevertheless, efforts should be supported to increase egg production in these countries.
References
FAO database: http://www.fao.org/faostat.
Windhorst, H.-W.: Regional Patterns of European Egg Production and Trade – with Special Reference to the EU. London: International Egg Commission 2010.
Windhorst, H.-W.: The Globalisation of Egg Production and Trade. London: International Egg Commission 2013.
Windhorst, H.-W.: The EU Egg Industry in Transition. London: International Egg Commission April 2017a.
Windhorst, H.-W.: The North American Egg Industry in Transition. London: International Egg Commission 2018a.
Windhorst, H.-W.: A projection of the future dynamics in global egg production. In: Zootecnica international 40 (2018b), no. 7/8, p. 24-26.


