

This study evaluated the performance of Hy-Line Brown hens with different body weights (BW) up to 100 weeks of age. Hens in the lowest BW quartile (Q1), which aligned with breed standards, showed the most efficient feed conversion and consistent egg production with better shell quality compared to heavier hens. Larger hens produced heavier eggs but with reduced internal and shell quality. These findings support maintaining hen BW at breed-standard levels to optimize egg quality and production efficiency in extended laying cycles.
Summary
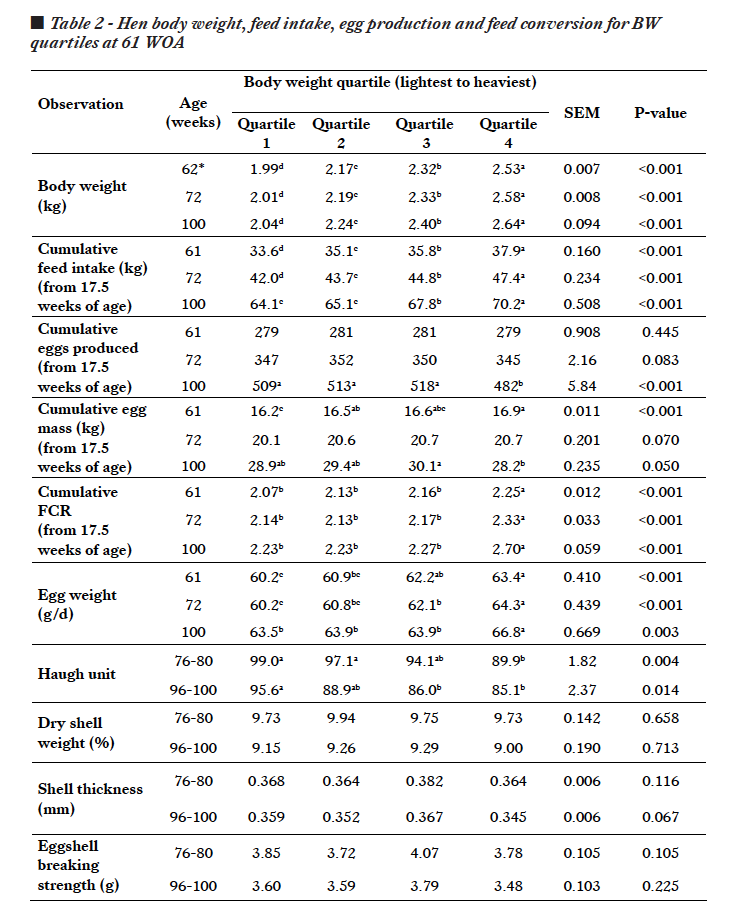
Commercial egg-laying hens that have incremental increases in body weight (BW) throughout the laying phase are prone to irregular persistency of lay and the production of large eggs with poor shell quality. They continue to accumulate abdominal fat through the laying cycle which typically ceases when they are 72-78 weeks of age (WOA). The table egg industry is moving towards extending the laying cycle until 100 WOA. In this study, the performance of Hy-line Brown hens, grouped based on BW, was assessed through to 100 WOA. The hens were housed in individual cages in a high-rise layer shed under 16 h light, with ad libitum access to feed and water from 17.5-100 WOA. They were retrospectively allocated to four BW quartiles at 62 WOA, i.e. quartile 1 (Q1), the lightest hens, BW 1.99 kg to quartile 4 (Q4), the heaviest hens, BW 2.53 kg. Hen BW and egg weight (EW) had been measured at 72 and 100 WOA and cumulative feed intake (FI), egg production (EP), cumulative egg mass (EM) and cumulative feed conversion ratio (FCR) were calculated for each BW Quartile from 17.5 WOA until 61, 72 and 100 WOA. Egg characteristics of Haugh unit (HU), relative dry shell weight, shell thickness and shell breaking strength were measured at 76-80 and 96-100 WOA. At 62, 72 and 100 WOA the BW of hens in each quartile were different with Q1 BW matching the breed standard BW for age. At 100 WOA, average BW was 2.04, 2.24, 2.40 and 2.64 kg for Q1, Q2, Q3 and Q4 respectively. Concurrently EW was 63.5, 63.9, 63.9 and 66.8 g; cumulative FI was 64.1, 65.1, 67.8 and 70.2 kg; cumulative EP was 509, 513, 518 and 482 eggs, cumulative EM was 28.9, 29.4, 30.1 and 28.3 kg, and cumulative FCR was 2.23, 2.23, 2.27 and 2.70 kg/kg respectively. At both 76-80 and 96-100 WOA eggs from Q4 birds were the heaviest but with the lowest HU. At 96-100 WOA the shell of eggs from Q4 hens was numerically (P=0.067) thinner than the eggshell of Q1-Q3 hens. There were no differences in relative dry shell weight nor eggshell breaking strength. These outcomes support management of egg-laying hens to maintain their BW at breed standard recommendation for age. i.e. Quartile 1. Compared to heavier hens, Q1 BW will achieve the most efficient production of good quality eggs.
Introduction
Hen body weight (BW) impacts feed intake (FI), feed efficiency and egg characteristics (Harms et al., 1981). Egg weight and egg production (EP) are central to commercial egg-laying hen performance and FI is pivotal to these outputs. However, higher FI is not necessarily associated with higher EW (Anene et al., 2021) or egg production (Cerolini et al., 1994; Lacin et al., 2008). However, higher hen BW is generally associated with higher FI, poorer feed efficiency (Lacin et al., 2008; Akter et al., 2018) and an increase in the number of abnormal eggs (Anene et al., 2021).
Studies of individually housed hens held under similar management and dietary conditions have shown considerable variation in their BW, FI, and feed efficiency (Akter et al., 2018; Muir, 2023). These variations can be evident early in the laying period, persisting through to mid-lay i.e. 40 WOA (Anene et al., 2021) and late lay i.e. 69 WOA (Muir et al., 2022). Given the interest of the egg industry in extending egg production cycles to when hens are 100 WOA (Bain et al., 2016) and the inclination for heavier hens in the Australian industry (Muir et al., 2023a), evaluation of BW effect on FI, EP, FCR and egg quality through an extended egg production period is required.
Data on hen performance and egg quality through an extended laying cycle of hens became available from a study that involved several lighting and feeding treatments during rearing (Muir et al., 2023b; Muir et al., 2024). Analysis of BW data when the hens were 62 WOA identified hens of a range of BW with each rearing treatment group. This presented an opportunity to explore the impact of differences in BW on performance and egg quality to the end of an extended laying cycle. The main study followed the original experimental design until hens were 100 WOA (Muir et al., 2024). Then, irrespective of their rearing treatments, the flock was retrospectively divided into four BW groups or quartiles (Q), based on BW at 62 WOA. The data were then analysed to assess the effect of hen BW in late lay on cumulative FI, EP, egg mass (EM), FCR and egg characteristics throughout an extended laying cycle.
Materials and methods
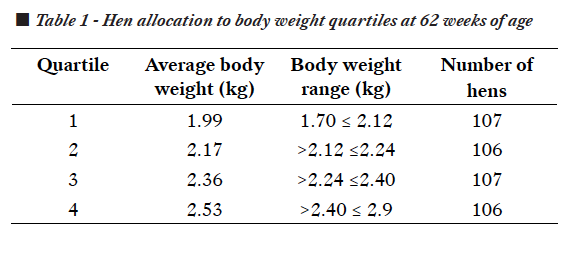
Hy-line Brown hens were housed in individual cages (25x50x50 cm) in a high-rise layer shed under 16 h light/24 h. From 17.5 until 100 WOA they had ad libitum access to layer diets appropriate for their stage of EP. Each hen’s individual EP, FI and the weight of each egg was measured. Subsequently EM and FCR were calculated. At 62 WOA, all 426 hens had been weighed. BW was used to retrospectively allocate hens to four BW quartiles (Q). The BW range, average BW and number of hens in each quartile are presented in Table 1. At 62, 72 and 100 WOA hen BW and EW were determined and cumulative FI, EM and FCR from 17.5 to either 61, 72 or 100 WOA were determined for each BW quartile (Table 2). At 76-80 and 96-100 WOA, 12 eggs from each of the BW quartiles were assessed for Haugh unit (HU), shell thickness, relative dry shell weight and shell breaking strength, as described by Muir et al. (2023a). All data were analyzed using a One-way ANOVA on generalised linear model procedure of STATISTICA Version 6 (Statsoft Inc. 2003). Means were separated by Tukey’s honestly significant difference test. Statistical significance was set at P<0.05.
 Results and discussion
The allocation of hens to BW quartiles based on their BW when 62 WOA generated four distinctive groups, ranging from the lightest Q1, average BW 1.99 kg to Q4, average BW 2.53 kg (Table 1). Each quartile contained a similar number of hens. The BW of the quartiles were also different from each other at 72 and 100 WOA (P<0.001; Table 2). The BW of Q1 hens corresponded with the Hy-line Brown recommended weight for age i.e. 2.01 kg at 72 WOA compared to recommended 1.91-2.03 kg and, 2.04 kg at 100 WOA compared to recommended 1.92-2.04 kg (Hy-line Brown Management Guide, 2018). At both ages the BW for Q2, Q3 and Q4 continued to be above breed standard weight for age.
During each period, i.e. from 17.5 to either 61, 72 or 100 WOA, Quartile 1 hens were the lightest BW group and consumed less feed in total (P<0.001) compared to Q3 and Q4. The higher FI of heavier hens has also been reported by others including Lacin et al. (2008) and Muir et al. (2023a). Further, the correlation between cumulative FI and BW when hens were 100 WOA was significant (r=0.52; P<0.005). Egg production through to 100 WOA was similar for Q1, Q2 and Q3 hens but Q4 hens produced fewer eggs than the former quartiles (P<0.001). Feed not used for hen maintenance and egg production is stored as abdominal fat, leading to ongoing weight gain, whereby the larger hens become obese, with more irregular egg quality and compromised hen health (Anene et al., 2021).
Cumulative EM was highest in Q4 hens at 61 WOA, and in Q3 hens at 100 WOA, with no differences when hens were 72 WOA. At 100 WOA the higher cumulative EM of Q3 hens was different to Q4 cumulative EM only. Cumulative EM produced by Q1 and Q2 hens to 100 WOA was not different to Q3 or Q4 hens, nor to each other. From 17.5 – 100 WOA the cumulative FCR of the Q1, Q2 and Q3 hens were similar, all being lower than the cumulative FCR of Q4 hens (P<0.001). This corresponds with other recent studies where lighter ISA Brown hens had lower FCR than their heavier counterparts at 55 WOA (Akter et al., 2018) and 69 WOA (Muir et al., 2022).
The heavier hens (Q4) produced the heaviest eggs, reflecting the observations of Muir et al. (2022) but contrary to Akter et al. (2018). Further, the heavier eggs of Q4 hens had the lowest HU (P=0.014; Table 2). Aligning with Muir et al. (2022), eggshell breaking strength and relative shell weight did not differ due to hen BW. However, at 96-100 WOA, the eggshells of the heavier Q4 hens were thinner (approaching significance, P=0.067) compared to the eggshells of the hens in Q1, Q2, and Q3.
Conclusions
Overall, compared to lighter hens, heavier hens consume more feed but without a corresponding increase in egg production. While their eggs are heavier, their FCR is notably poorer. Hence it is recommended that hens are maintained close to the breed standard weight for age throughout an extended laying cycle. This will optimise FI and FCR while maintaining good egg size and eggshell quality without compromising egg production.
Acknowledgment: Thank you to Australian Eggs for funding this research.
References
Akter Y, Greenhalgh S, Islam MRE, Hutchison C & O’Shea C (2018). Journal of Animal Science 96: 3482-3490.
Anene DO, Akter, Y, Thomson PC, Groves PJ, Liu S & O’Shea C (2021) Animals 11: 1-14.
Bain MM, Nys Y & Dunn IC (2016) British Poultry Science 57: 330-338.
Cerolini S, Mariani P, Cavalchini LG & Filoni P (1994) European Journal of Poultry Science 58: 30-38.
Harms RH, Costa PT & Miles RD (1981) Poultry Science 61: 1021-1024.
Hy-line International. Hy-Line Brown Commercial Layers, Management Guide (2018). https://www.hyline.co.uk/uploadedfiles/1592407567-brn_com_eng.pdf.
Lacin E, Yildiz A, Esenbuga N & Macit M (2008) Czech Journal of Animal Science 53: 466-471.
Muir WI (2023) Proc. Aust. Poult. Sci. Symp. 34: 98-105
Muir WI, Akter Y, Bruerton K & Groves PJ (2022) Poultry Science 101: 102041
Muir WI, Akter Y, Bruerton K & Groves PJ (2023a) Poultry Science 102:102338
Muir WI, Akter Y, Bruerton K & Groves PJ (2023b) Proc. Aust. Poult. Sci. Symp. 34: 201-204.
Muir WI, Akter Y, Bruerton K & Groves PJ (2024) Proc. Aust. Poult. Sci. Symp. 35: 105-108.
Statsoft Inc. (2003). STATISTICA (data analysis software system) version 6.
From the Proceedings of the Australian Poultry Science Symposium 2025, by courtesy of the Poultry Research Foundation.


