

Egg breakout or hatch residue analysis is one of the most powerful diagnostic tools in a hatchery. Breakouts can be used to aid troubleshooting, establish trends, and optimize hatch results. The egg tells a story of the timeline of events from when the egg is formed inside the hen all of the way through the hatching process. Egg breakouts do not substitute looking at the birds, but provide important insight into breeder nutrition, health, egg handling, incubating and hatching parameters. When used in conjunction with other hatchery tools, significant progress can be made. Unfortunately, breakouts are often times overlooked and underutilized due to the lack of understanding their importance, inability to interpret them or lack of time and resources.
Would you diagnose a flock issue or try to optimize flock performance without looking at the mortality or examining the flock’s history? Of course you wouldn’t! Breakouts should not be considered any differently. How can we diagnose hatch issues, establish trends, or optimize hatchability without considering embryonic mortality? The answer is we can’t!
While most hatcheries conduct some sort of hatch residue breakout, the program is often times lackluster. The program may only consist of looking at the “poor hatches”, only look at one tray or use generic breakout sheets. In order to establish trends, track embryonic changes, or identify potential areas to improve hatch, you must examine the breakouts thoroughly and frequently. In order to understand the “poor hatches”, you must understand what embryonic mortality is in the “good hatches” and have a base understanding as to what is “normal” for specific lines and for specific weeks in lay. Once “normal” has been established and expectations are set, slight variation can be easily seen.
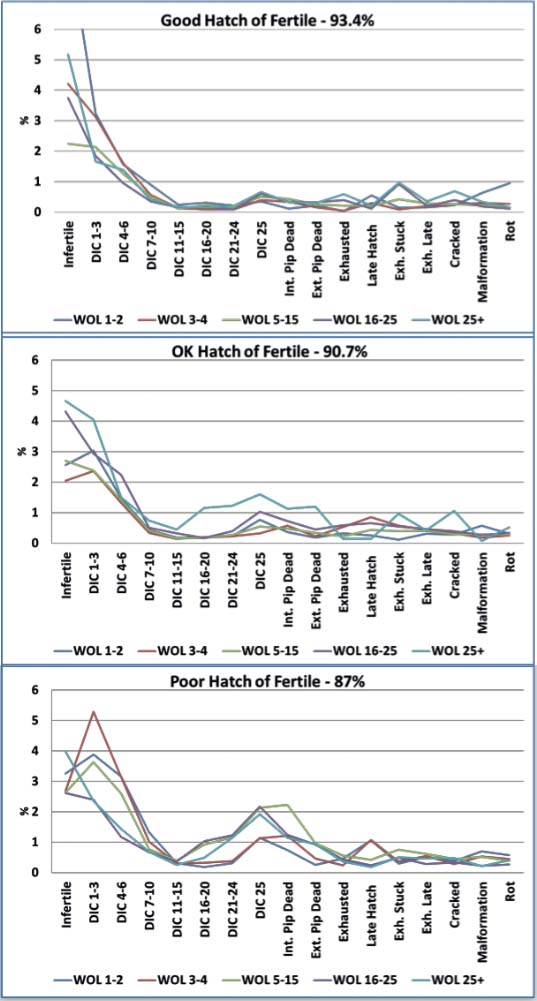
In Figure 1, you can see three life of flock breakouts by hatch of fertile (HOF) broken down by week of lay (WOL). Each of these flocks tells us a very different story. How we optimize hatch and poult quality in each scenario is very different.
Examination of one tray is insufficient to give an accurate representation as to what is going on in a machine or flock. Breakouts will change based on location in the cooler, incubator, and or hatcher. One tray is not a large enough sample size to account for all the inherent hatchery variables.
For example if you breakout one tray from the same location every hatch, you will miss the bigger picture. What if the tray you sampled always contained late hatches, because it is from the cool spot in the incubator? You could potentially miss problems with the rest of the machine exhibiting classic signs of overheating, such as increased late dead and short deformed legs.
Furthermore, breakout profiles change alongside genetics. Genetic progress affects embryonic growth. Trends and patterns are slowly changing and evolving over time and the aforementioned life of flock HOF graphs will change slightly over time as will the embryonic requirements. These small changes will go unnoticed if routine breakouts are not being analyzed and the opportunities for optimizing embryonic requirements will be missed.
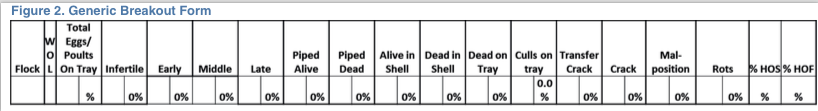
Many hatcheries use a very generic and general breakout sheet. This typically characterizes the week of embryonic death and a few other categories unrelated to incubation, such as cracked or rots. An example of a generic breakout form can be seen in Figure 2.
The key to unlocking the potential diagnostic tool of egg breakouts lies in the specificity of the breakouts. Embryos are very sensitive to toxins and nutrient deficiencies. Therefore, toxin and nutritional deficiencies will show up in the embryo before clinical signs will be seen in the breeder flock regarding health or egg production.
The more detailed and descriptive the breakouts can be, the more useful the information becomes. For example, if you have a number of embryos that are classified as late dead, and don’t know any further details, there are about a dozen different things that could have caused the increase in mortality. It could have been an issue in the incubator, the hatcher, in the transfer process itself, in egg handling, or it may even be “normal” for this particular week of lay.
If you take that same set of breakouts, classify them as an internally pip deads with residual albumen, deformed legs, and short legs, a very different picture starts to develop. Once a clearer picture is revealed, you can then begin to tackle the root of the issue and progress can be made.
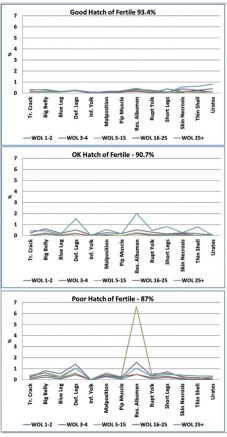
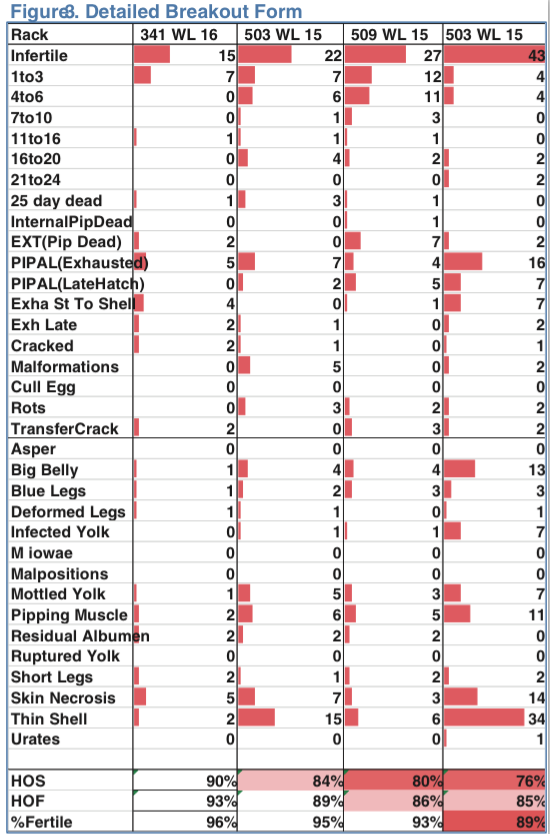
There are many other scenarios, similar to this one, which is just one very small example. In Figure 3, you will see an example of a very detailed residue breakout form. The concept of “normal” must be established with regards to embryonic lesions. Just as we previously saw embryonic mortality characteristics by HOF and week of lay in three flocks, breakout lesions will also vary based on flock and week of lay. The accompanying breakout lesions with flocks previously analyzed can be seen in Figure 4. The lesions provide additional information on how to tackle the individual flock issues.
The two most stressful times for an embryo are when the embryo initially starts to develop and during the hatching process. Therefore the bulk of the embryonic mortality will occur at that time. With regards to lesions, embryos will undergo changes in gene expression due to environmental stressors for survival.
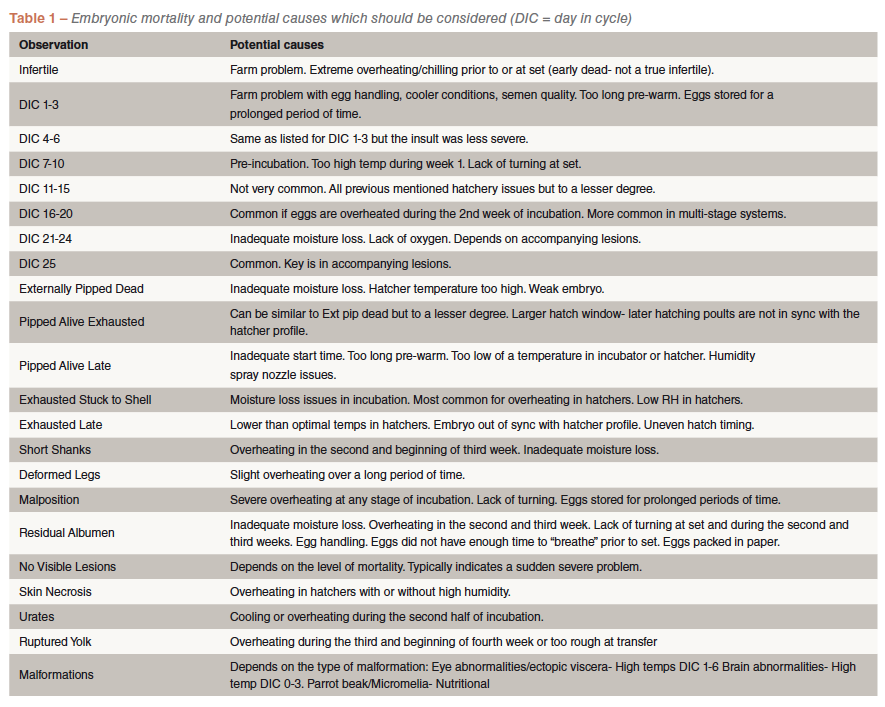
Environmental stressors are only one of the many causes of abnormal breakouts. Other causes of abnormal breakouts include breeder flock nutrition, fertility, and health, egg handling, as well as incubator and hatcher conditions. It is not enough to identify the stage in embryonic mortality, lesions, and abnormal breakouts, you must also be able to interpret what the data is telling you. Figure 5 gives a list embryonic mortality and lesions and their potential causes.
Egg breakouts take time and resources but are an essential hatchery operation to identify normal and abnormal patterns of development. Whilst the payback is not initially as obvious as one would like, it will pay significant dividends when problems emerge. Therefore, a concerted effort must be made to ensure breakouts are being done frequently and thoroughly.
Summary
The opportunity is in the trends and details. Nowhere else can anyone find a record of events from embryo formation to hatch. Breakouts will tell you all that you need to know, you just need to look and listen. Many opportunities are thus being missed by overlooking and underutilizing egg breakouts. The answers are often times right in front of us.


