

Avian reovirus (ARV) is the main cause of viral arthritis and tenosynovitis in chickens and turkeys, triggering economic losses in the poultry industry due to impaired feed conversion rates, lack of uniformity and increased condemnations in the affected flocks worldwide.
ARV’s are non-enveloped viruses. Its genetic material is formed by ten segments of double-stranded RNA. These features allow a high mutation and recombination rates, escaping the immunity elicited by vaccines. Classical vaccine strains such as S1133, 1733 and 2408, have been used since the 1970’s and molecular variants homologies to these vaccines are frequently under 80%.
For years, molecular variants have been detected and classified into five and six genotypic clusters based on the S1 gene, that encodes for the Sigma C protein. Nevertheless, we know that characterizations based on S1 don’t provide the full picture and do not correlate with antigenicity and pathogenicity of these strains is a quick and easy method to group these isolates. Since the viruses incorporated in autogenous vaccines are selected, in part, based on S1 characterization, it is necessary to reconsider the approach.
Previous studies in our laboratory have suggested that other genes i.e. M2 and L3, coding for outer structural proteins, have a high variability and would be good candidates for classification of molecular variants of avian reovirus and might be associated with pathogenicity and antigenicity. Since 2015 we have started a molecular characterization effort based on a S1 characterization and grouping of the isolates obtained by the California Animal Health and Food Safety Laboratory. In addition, we have selected distinct isolates to perform full genome sequencing looking for differences and variability of the different reovirus genes.
Materials and methods
One hundred and fifty reovirus isolates were selected based on clinical importance, year, tissue of isolation and cytopathic effect in cell culture (CPE). Confirmed isolates were submitted to an S1 gene RT-PCR and sequencing using the forward and reverse primers. The resulting sequences were aligned with the commercial vaccine S1133 in order to compare homologies. Phylogenetic trees were crafted in order to visualize the classification of the avian reovirus molecular variants. Seventeen representative isolates were selected and whole genome sequenced and classified in order to check gene associations. Statistical data analysis and graphs were made using PRISM Graph Pad.
Results
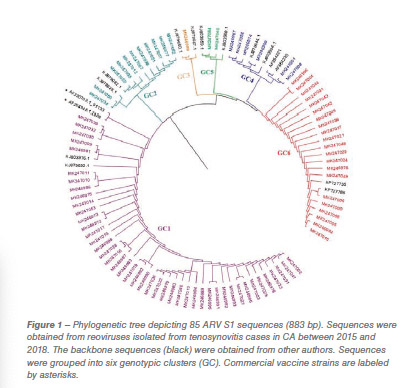
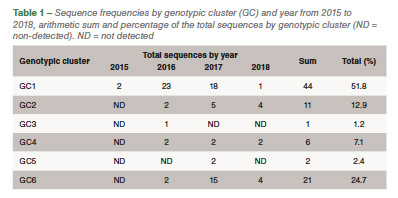
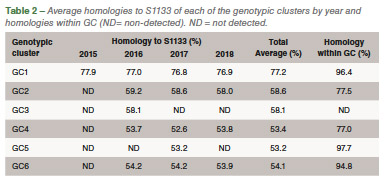
Eighty-five out of 150 (56,6%) ARV S1 segment (1,088 bp) were effectively RT-PCR amplified, sequenced and classified into six genotypic clusters (GC). In 2016 the GC1 strains were predominant with approximately 80% of the variants for that year. In 2017, CG6 increased it representation with 31% of the sequences while GC1 was still the most predominant with 40% (Figure 1). The average homology of each GC to S1133 was calculated and shown in Table 1. The percent homologies to S1133 of the S1 sequences by year showed consistency. GC1 was the group with the highest homology to S1133 while GC4, GC5 and GC6 the groups with the lowest homologies. In order to assess the similarity of the S1 sequences within each cluster we calculated the homology within GC. From high to low, these homologies were GC1 (96.4%), GC2 (77.5%), GC4 (77.0%), GC5 (97.7%) and GC6 (94.8%) (Table 2). A summary of the sequence distribution on the different genetic clusters and their homologies by year are shown in Figure 2. A considerable reduction of sequences clustered in GC1 was followed by an increase in GC2, GC4 and GC6. GC3 was first identified in 2016, GC5 was first identified in 2017. Seventeen avian reovirus isolates associated with clinical signs in the field, were selected for full genome and serotype studies.
Discussion
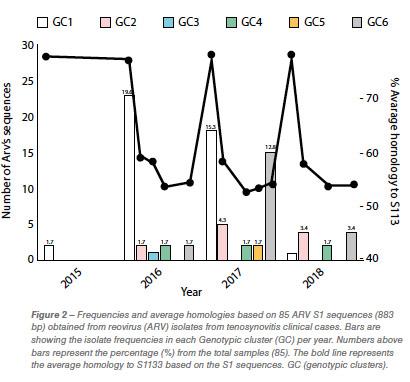
Molecular surveillance is crucial to control and prevent pathogenic avian reovirus outbreaks. Using the primers described by Kant et al., only 85 out of 150 (56.6%) partial S1 genes were detected, amplified and sequenced. We attribute the lack of amplification of more than 30% partially to the molecular divergence on ARV variant strains. Kant et al., using the same primers between 1980 to 2000, had a slightly higher amplification success (70%). Partial S1 gene characterization methods have classified avian reovirus strains into five and six genotypic clusters. Our research showed that strains isolated in California belong to all six distinct genotypic clusters. The most predominant clusters were GC1 (51.8%), GC6 (24.7%) and GC2 (12.9%). Similar results were described in Europe. While Lu et al. stated that most of their sequences clustered in GC2, followed by GC4 and GC1, Palomino et al. affirmed that their most predominant sequences were from GC5, followed by GC4 and GC1. The “cluster” nomenclature is used to compare the viruses detected in different parts of the country and the world even though, we need to take into consideration the fragment size, number of sequences in the analysis, sequences selected as backbone and the subjectivity of the analysis. These factors play a role in the conformation of the clusters. Between 2015 and 2018, the avian reovirus isolates genotypic cluster representation in the State of California has changed. A decrease on the representation of GC1 and an increase of GC6 classified strains have occurred (Table 2). Multiple factors might be influencing this shift, including the use of autogenous vaccines. The use of certain GC’s as a predominant antigen in autogenous vaccines might be important in driving the change in the representation of that genetic cluster. Our hypothesis relies in the fact that inactivated non-homologous vaccines provide partial protection to the field challenge not eliminating viral shedding from infected birds. This allows selection of strains different than the vaccine altering the representation of avian reovirus in the environment. Homologies to a reference commercial vaccine strain showed that GC1 had the highest homology. Even though, GC1 is the group that encompasses the vaccine strains, the average homology of this group was under 78%. The rest of the GCs had average homologies to S1133 between and 53.2%, very distant from the viruses that are used in commercial live and inactivated vaccines explaining the lack of effectiveness of these vaccines in the generation of protection. Based on the homologies over time, we see that each of the clusters have maintained their homologies to S1133 since 2016 (Figure 2).
References are available on request
From the Proceedings of the 68th Western Poultry Disease Conference


