
A preceding article documented the development of global meat1 exports (Windhorst, 2026). This follow-up article analyses the dynamics in meat imports.
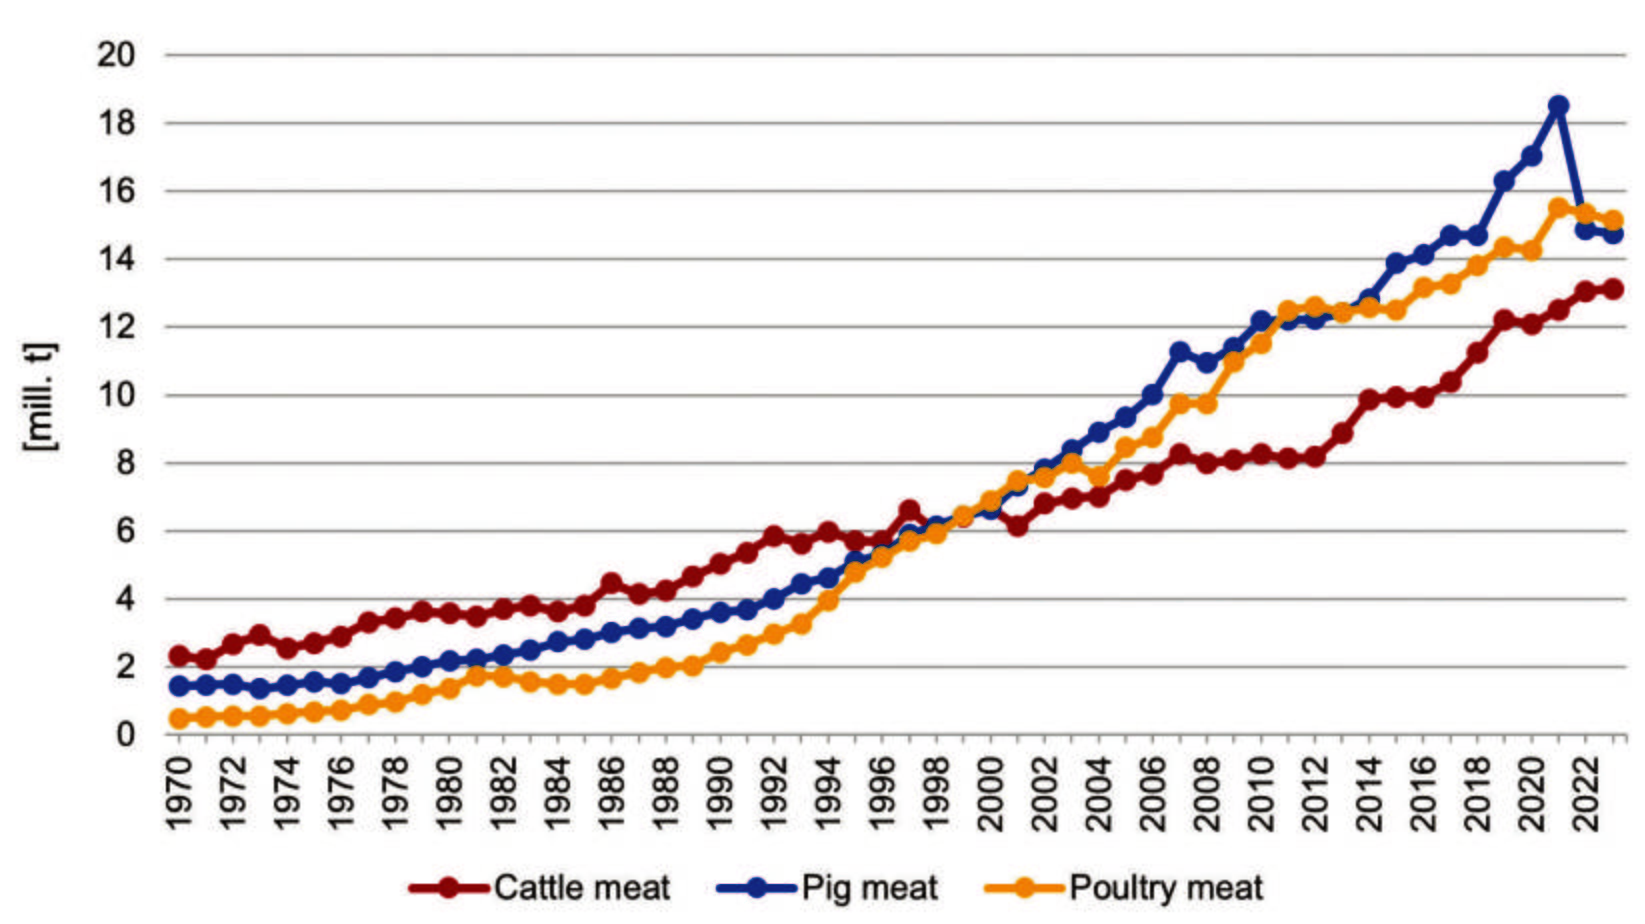
Between 1970 and 2023, global meat exports rose from 4.0 million mt2 to 43.2 million mt, an increase of almost 980%. Looking at the development of the import volumes separately by meat type (Figure 1), it can be seen that they grew almost in parallel. However, it is noteworthy that imports of cattle meat exceeded those of pig meat and poultry meat until the end of the 1990s. In the following two decades, poultry meat and pig meat alternated several times in the top position. The sharp rise in pig meat imports towards the end of the last decade was a result of the outbreaks of African swine fever in Asia. This article will analyse both the longer-term development and the dynamics since 2000 in detail.
Long-term development – Parallel dynamics
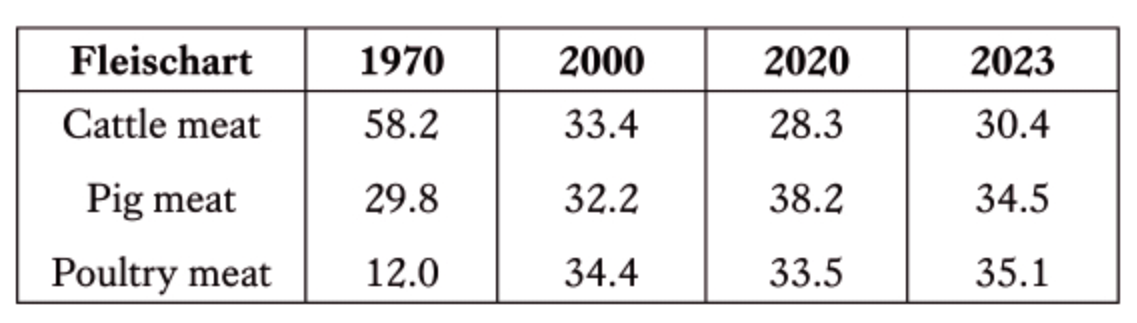
An analysis of meat import development between 1970 and 2023 shows a remarkable parallelism in the three meat types considered here (Figure 1). However, the absolute and relative growth rates differed considerably. In 1970, the import volume of cattle meat was about twice as high as that of pig meat and almost four times higher than that of poultry meat. Cattle meat accounted for 58.2% of total imports of the three meat types, pig meat for 29.8% and poultry meat for 12.0% (Table 1). Until 2023, poultry meat imports grew by 14.6 million mt, or a thirtyfold increase, pig meat imports by 13.7 million mt, more than tenfold. Although cattle meat showed the lowest absolute growth at 10.7 million mt, it still increased almost fivefold compared with 1970. The different dynamics resulted in considerable changes in the shares of meat types in total meat imports. While the share of poultry meat roughly tripled, that of cattle meat almost halved. It is striking that pig meat recorded a significant increase in market share between 1970 and 2020. This distribution pattern was still largely present in 2023. However, as can be seen from Table 1, it differed in 2020 from that in 2000 and 2023. The reasons for this will be discussed in more detail in a later section of the paper.
Source: own calculation based on FAO data.
Medium-term development – Momentum continues
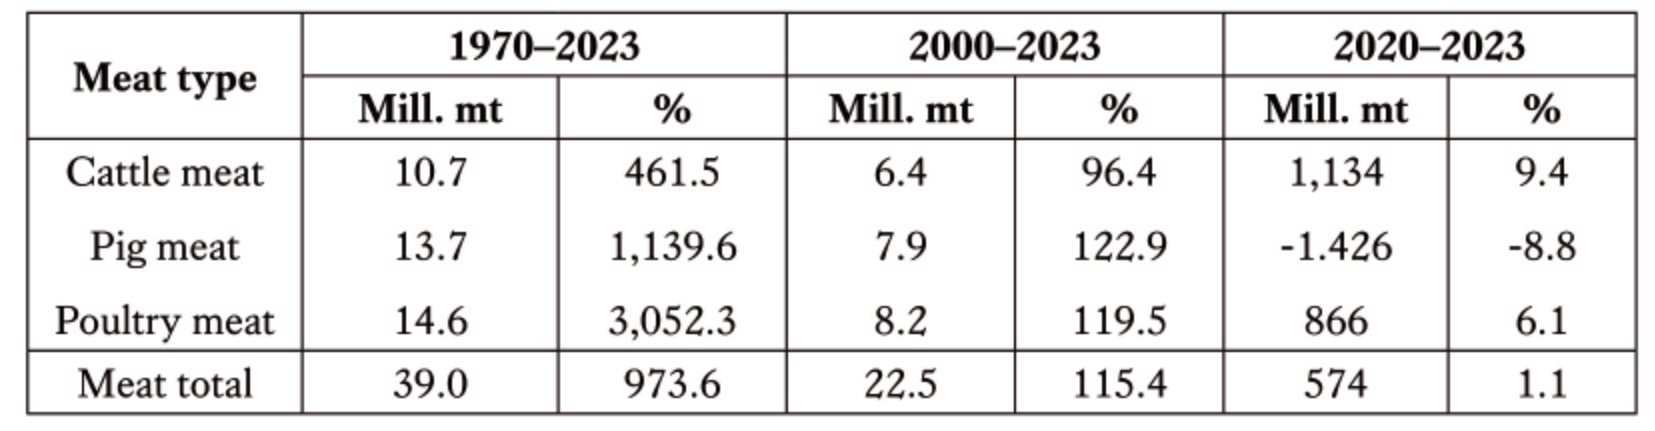
In the next step, it will be analysed how meat imports developed between 2000 and 2023. Table 2 shows that the momentum continued during this period. The import volume increased by a total of 22.5 million mt. Imports of pig meat and poultry meat more than doubled, while cattle meat imports rose by 96.4%. The largest absolute increase, at 8.2 million mt, was in poultry meat, while the highest relative increase, at 122.9%, was in pig meat.
Source: FAO data.
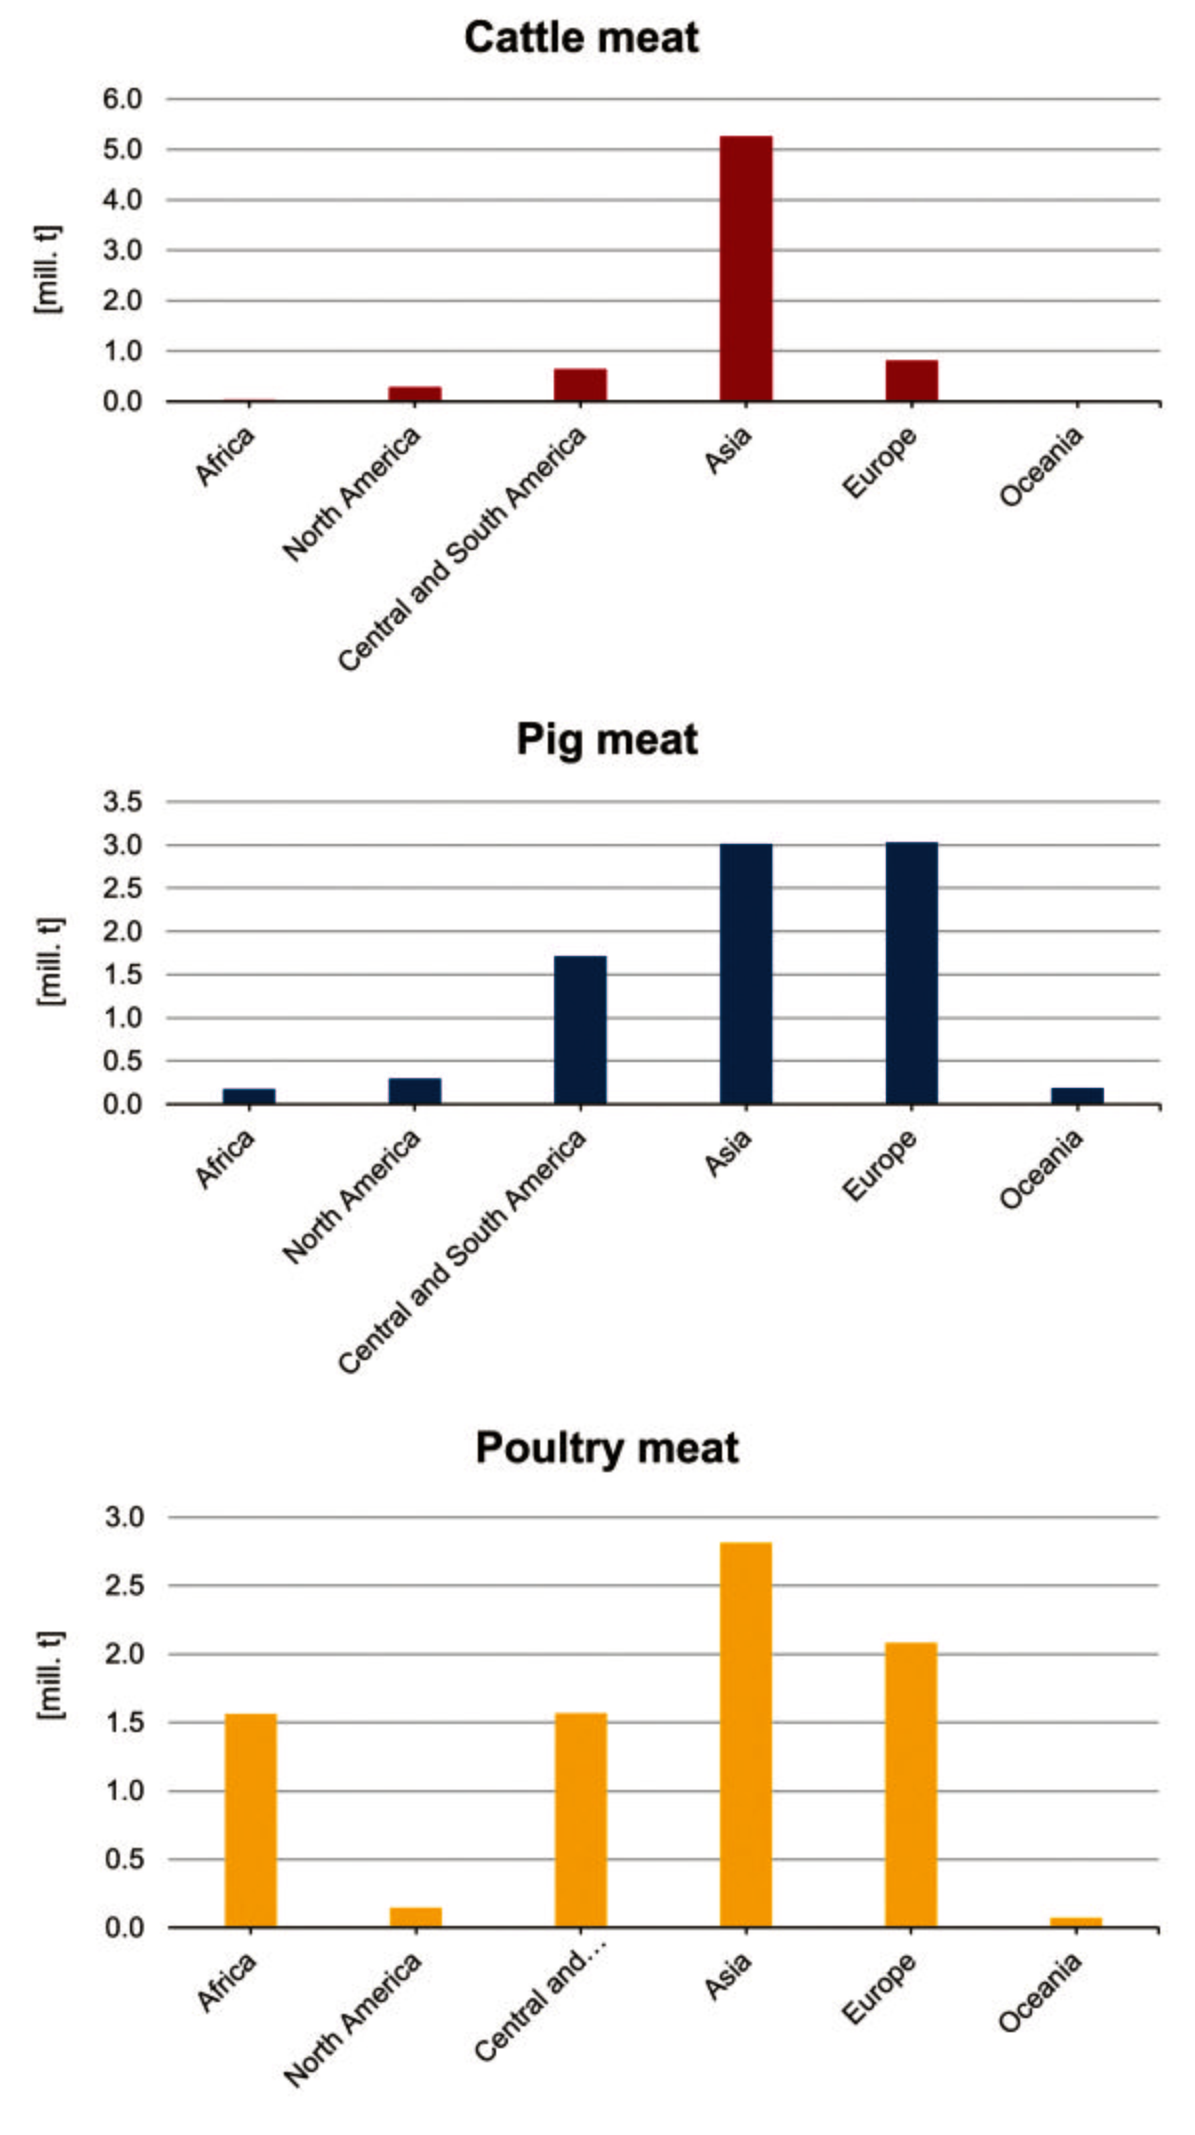
Looking at the continents, there are notable differences (Figure 2). Asia took the unchallenged lead with an increase in meat imports of 11.1 million mt, followed by Europe with 5.9 million mt and Central and South America with 3.9 million mt. Surprisingly, the two North American countries recorded a significantly lower growth of only 727,000 mt. High domestic production and self-sufficiency were the decisive reasons for the low imports.
Design: A. S. Kauer based on FAO data.
In terms of cattle meat, Asia ranked first with an increase in imports of 5.3 million mt, well ahead of Europe and Central and South America. Imports from the other continents were insignificant in comparison. Regarding pig meat, Europe and Asia had equal imports of 3.0 million mt each, followed by Central and South America with 1.7 million mt. Here, too, the import volumes of the other continents were comparatively small. Asia and Europe also took the leading positions in poultry meat. It is worth noting that Central and South America and Africa imported almost equal quantities of poultry meat, at 1.6 million mt each. The high imports of Central and South America are surprising, as the continent was in the leading position in exports with an increase of 4 million mt in the same time period. A detailed analysis at country level would show that Brazil had a high export surplus, while Mexico and some other countries in Central and South America had to import poultry meat to supply their populations.
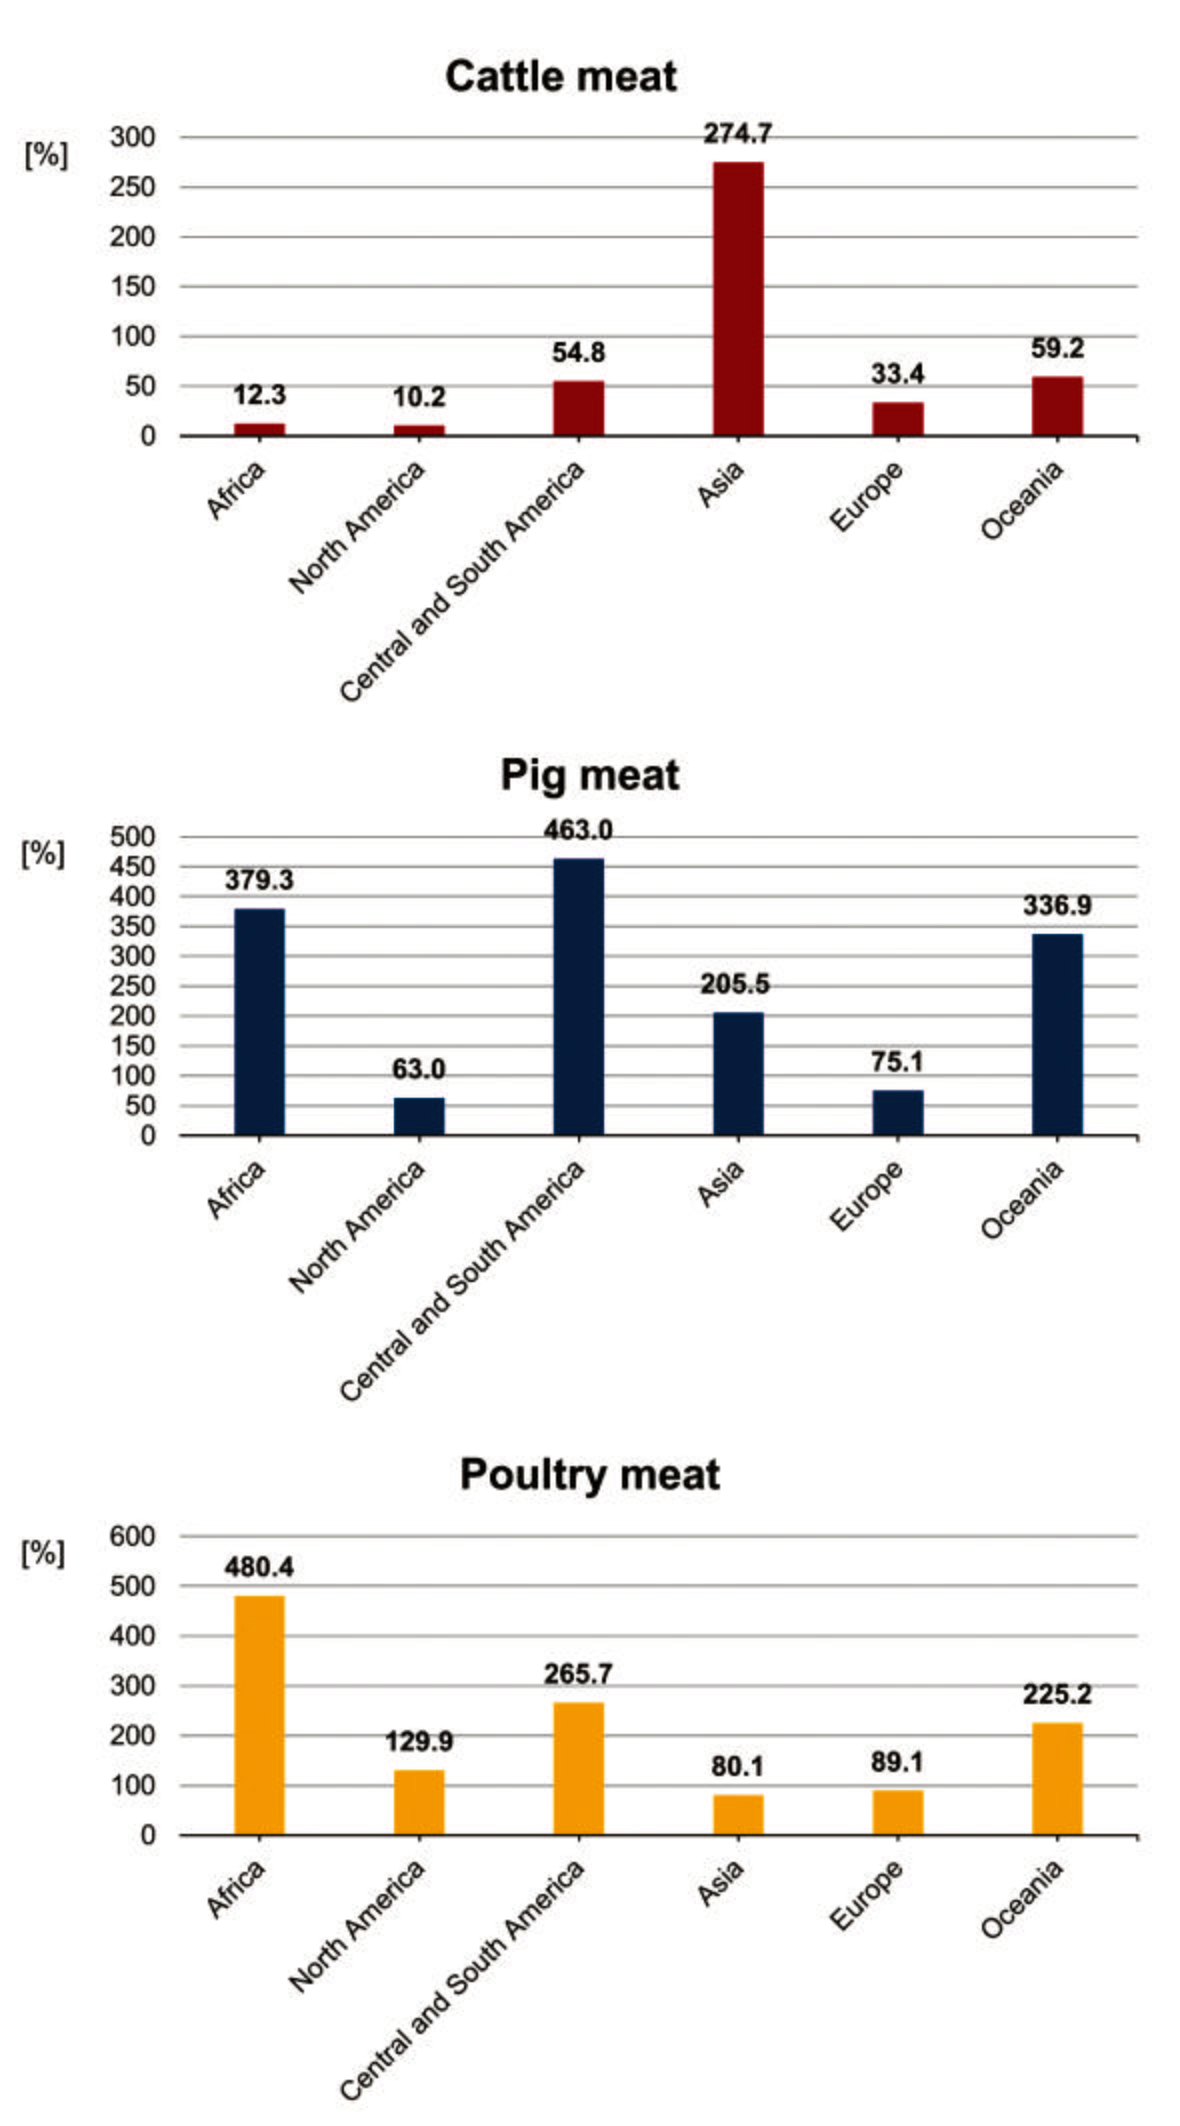
The dynamics observed during the period under review can best be documented by the relative growth rates. Figure 3 compares developments at continent level and by meat type. The highest relative increase in cattle meat imports showed Asia at 274.7%, followed by Oceania at 59.2% and Central and South America at 54.8%. Significantly lower growth rates were achieved in the other continents.
Design: A. S. Kauer based on FAO data.
The highest growth rate for pig meat showed Central and South America at 463.0%. This was followed by Africa at 379.3%, Oceania at 336.9% and Asia at 205.5%. Growth rates were much lower in Europe and North America. Both continents had a high degree of self-sufficiency. A detailed analysis at country level would show that in Africa it was mainly the non-Islamic countries that increased their imports. In Oceania, the rapidly rising per capita consumption led to increased imports, particularly by New Zealand, Australia and Papua New Guinea.
At first glance, it is surprising that Africa achieved the highest growth rate of 480.4% for poultry meat. This was mainly due to the increased demand from Islamic countries in North Africa. In Oceania, imports have risen particularly since 2019 as a result of the COVID-19 epidemic. At 255.7%, Central and South America saw the highest relative increase among the continents with a large production volume. At first glance, the high growth rate in North America is surprising. This can be explained by the massive outbreaks of avian influenza in 2022 and 2023, which made imports necessary to supply the population. Imports by the USA rose by around 160,000 mt or 839% between 2020 and 2023 alone.
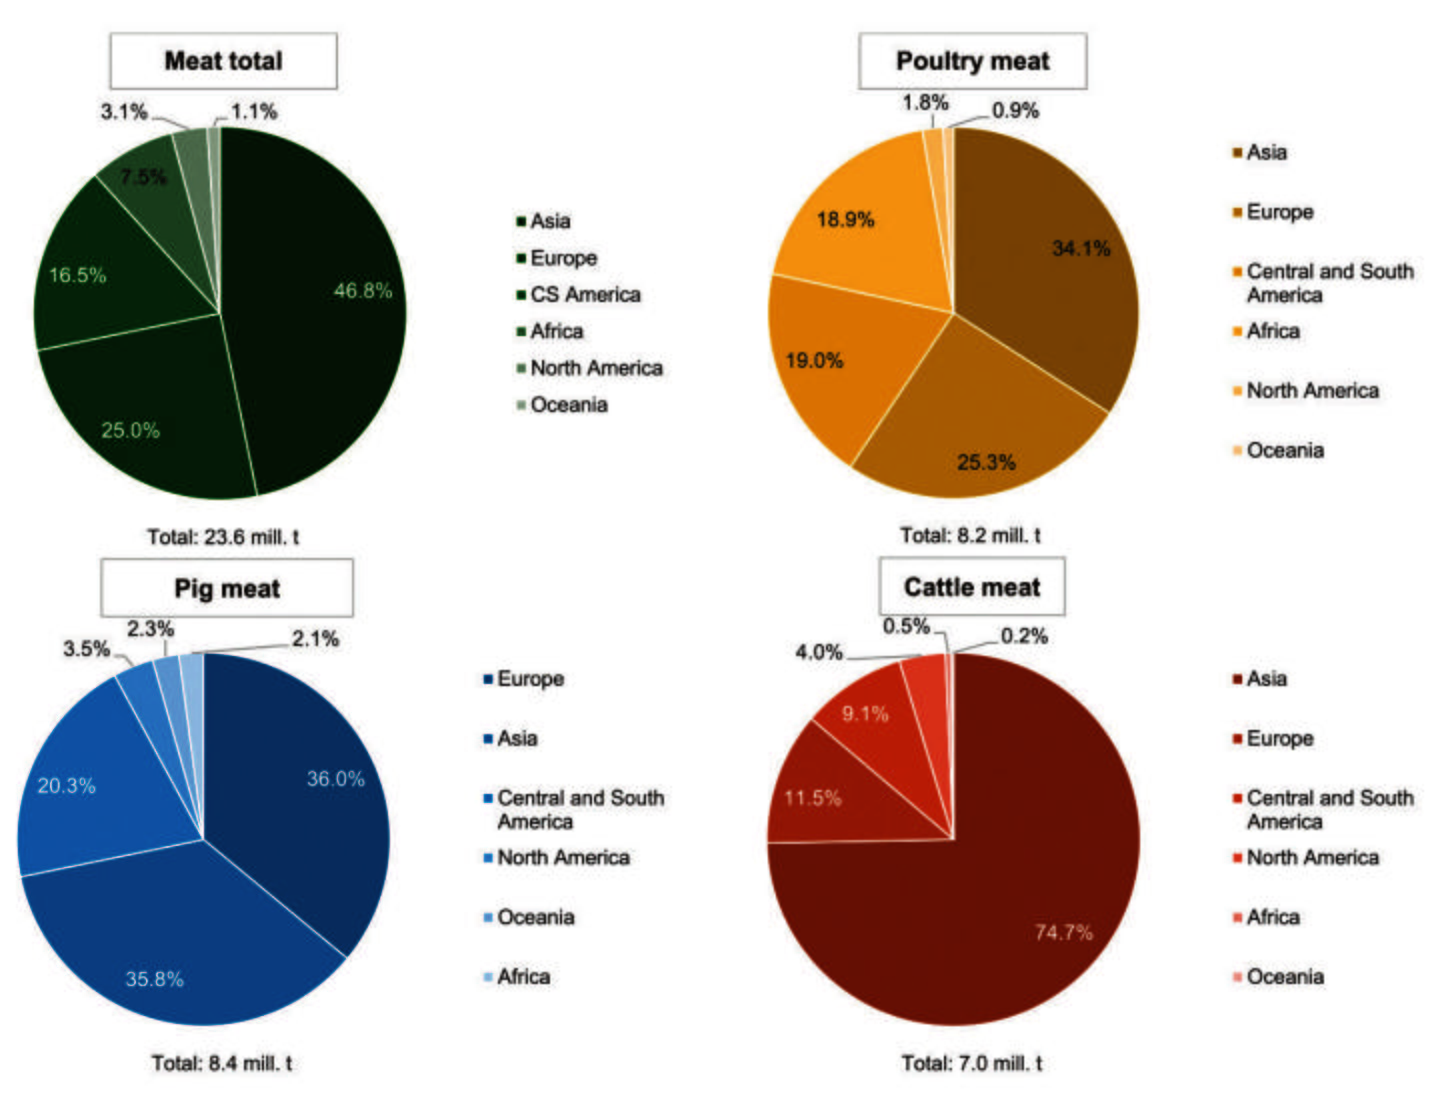
Figure 4 documents the role of each continent in the development of global meat imports between 2000 and 2023. Asia’s dominant position in meat imports is reflected in its 48.8% share. Europe and Asia had almost equal shares in pig meat imports. Both continents occupied the top two positions for all three meat types, with Asia’s exceptional position in cattle meat imports being particularly noteworthy. It is remarkable that Central and South America ranked third overall and for individual meat types, while North America played only a minor role in meat imports. This can be explained by the large domestic production and the resulting high degree of self-sufficiency.
Design: A. S. Kauer based on FAO data.
Short-term developments – Animal diseases and the COVID-19 pandemic
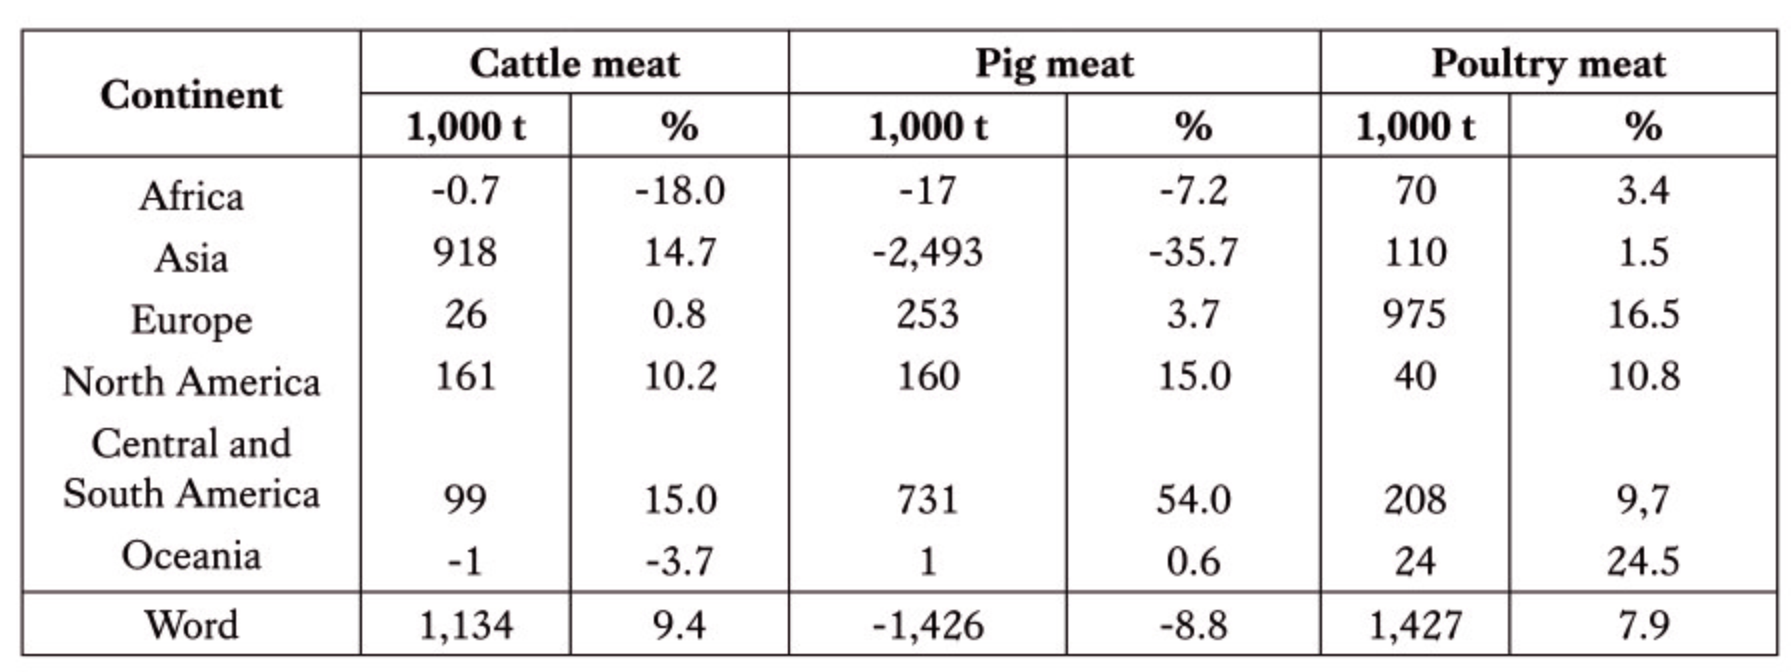
The analysis of the development of imports of the three meat types considered here shows that the dynamics of pig meat imports was interrupted between 2020 and 2023. Imports fell by 1.4 million mt, or 8.8%. In contrast, imports of cattle meat and poultry meat continued to rise, with cattle meat imports increasing by 1.1 million mt and poultry meat imports by 1.4 million mt (Table 3). Cattle meat imports grew particularly in Asia, poultry meat imports in Europe.
Source: own calculation based on FAO data.
The development of pig meat imports was largely determined by the dynamics in Asia. Here, imports decreased by 2.5 million mt or 35.7%. This sharp decline is attributable to China’s successful efforts to combat African swine fever. While China’s imports fell by 2.6 million mt, they continued to rise in some countries in Southeast Asia (Malaysia, Philippines) due to ongoing new outbreaks of the disease. South America recorded a sharp increase in imports of 731,000 mt, or 54.0%. Of this, 533,000 mt were accounted for by Mexico alone.
Europe shared more than two-thirds in the 1.4 million mt increase in poultry meat imports. Although imports by other continents were significantly lower, they reached 208,000 mt in Central and South America and 110,000 mt in Asia. The highest relative growth rate showed Oceania, at 24.5%. Europe’s high imports reflect the change in consumer behaviour during the COVID-19 epidemic. Because most restaurants and canteens in schools and universities were closed, more meals were prepared in private households.
Conclusion and outlook
The preceding analysis showed that global meat trade was remarkably dynamic in both the long and medium term. Imports of the three meat types considered here rose almost in parallel between 1970 and 2023, reflecting the growing global demand for meat. Since 2020, however, an interruption occurred in the dynamic development of pig meat imports, while cattle meat and poultry meat imports grew at a considerable level. In addition to the COVID-19 pandemic, which significantly changed consumer consumption and purchasing behaviour, outbreaks of avian influenza in North America and the successful control of African swine fever in China resulted in considerable changes in trade flows.
As demand for meat will continue to rise significantly in the current decade, an increase in meat trade can be expected. Central and South America in particular will be able to expand its share in world trade. Whether Europe will be able to import less meat in the future will depend on the ability of the farmers to prevent major outbreaks of avian influenza and African swine fever. Asia, whose meat production is also threatened by highly infectious diseases, is likely to continue importing large quantities of cattle meat and pig meat. North America’s role in meat trade will depend primarily on whether the spread of avian influenza in poultry meat herds can be prevented. A new epidemic that has been emerging since September 2025 is expected to cause supply problems not only for eggs but also for poultry meat. Africa will in future play an increasingly important role in meat imports because its rapidly growing population, combined with a middle class with a greater purchasing power, will demand more meat on the world market.
Data sources and additional literature
Food and Agriculture Organization of the United Nations. (n.d.). FAOSTAT. https://www.fao.org/faostat
Windhorst, H.-W. (2024). China’s role in meat production and trade. Fleischwirtschaft International, (3), 8–13.
Windhorst, H.-W. (2024). ASEAN – The dynamics of the meat industry in a hardly recognized economic area. Zootecnica International, 46(11), 28–35.
Windhorst, H.-W. (2025). Dynamics and structure of meat production and meat trade in the USA between 2019 and 2023: Part 2. Meat trade. Meatingpoint, (60), 6–10.
Windhorst, H.-W. (2025). Oceania – Disadvantage of peripheral location. Fleischwirtschaft International, (1), 14–21.
Windhorst, H.-W. (2026). The dynamics of global meat production. An analysis of the period from 2000 to 2023 – Part 1. Zootecnica Poultry magazine, 1, 20–26.
Windhorst, H.-W. (in preparation). The dynamics of the global meat trade. An analysis of the period from 2000 to 2023 – Part 3: exports. Zootecnica Poultry magazine, 4.
1 Only the three most important meat types, beef, pork and poultry, are considered; the data for beef includes buffalo meat.
2 1 mt = 1,000 kg.


