Predicting how a turkey flock might grow under different nutritional and environmental conditions is a question of interest to everyone involved in turkey production and this interest has led to the development and use of different types of predictive models for possible use as management tools.
Producers and growers will have the data from previous flocks grown under similar conditions. Such data, accumulated over farms and years, has been used for a long time in the well-known Agristats service in the US. More recently a lot of work has been aimed at using AI techniques to create data-based models to predict what will happen in future flocks under different conditions. The value of these techniques in poultry production has yet to be established.
The most widely used model in poultry science is the pen trial – in which small groups of birds (usually replicated) are assumed to predict how future flocks will behave under similar conditions. The results of such trials can produce statistical models which may be used for making predictions. The combination of results from many similar trials using some form of meta-analysis can enhance the predictive value of this work.
The final group of models – and the one we are interested in are grouped under the heading mechanistic. This is not a very specific definition but generally these models will include some ideas about the mechanisms of growth – even if it is at a very high level of organisation – and will, at least in theory, be less dependent on empirical data and therefore applicable over a wider range of conditions. An obvious question is whether they are constructed in such a way that continuous genetic improvement in turkey stocks can be accommodated without the need for newly generated empirical data. The system about which we are trying to make predictions is very complex. A turkey flock – even quite a small flock – in a single house is subject to a huge number of influences, each of which can affect the performance of the birds. It is even more complex if the birds are free ranging in a woodland! Thus, model building involves considerable simplification of the system and an acceptance that some factors may not be captured at all in the simulation. Animal health is an obvious example. So the system of describing turkey growth that we use, and that forms the background to our experiments, starts off with some quite simple, but as it turns out, very powerful, assumptions.
Components of growth
Three simplifying assumptions are made. First the increase in bodyweight is seen as the sum of three components: feathers, feather-free body and gut fill. Second that the feather-free body is composed of body protein, lipid, ash and water. (carbohydrate is ignored). Thirdly, the protein content of the feather-free body is seen as the base component of prediction from which the other elements are calculated. This level of description allows transactions in energy, protein and lipid to be calculated; and by extension, individual amino acids.
Potential growth
For the purpose of modelling we use a specific description of “how does your turkey grow?” which we call potential growth. This turns out to be a very powerful and useful idea but at the same time it is something which cannot be defined and measured with complete certainty. However, it is so useful for model construction that we have continued to use it and to try and measure it. Potential growth is defined as growth which is observed under non-limiting conditions and the potential growth of feather-free body protein, body lipid and feathers are assumed to be genetic characteristics of each animal. In order to make our models work at all i.e. for the animal to eat food and grow over time, we further assume that the animal seeks to achieve its potential growth and we try to model the extent to which it can accomplish this. The uncertainty arises from the definition of non-limiting conditions. We can feed the birds very well, in some cases giving a choice of feeds to satisfy individual needs, we use low stocking densities and try to create an environment in which the birds are always thermo neutral (a thermal gradient will assist in this). There is always uncertainty about the assumptions being made and of course there are intangible issues such as health which can only be dealt with in a very general way. Despite this the potential performance of several species; broiler, pig and even the ostrich, has been established with enough confidence to proceed with useful modelling.
Turkey experiments
The experiments were carried out at the University of Life Sciences and the International Testing Station in Prague and we are grateful to colleagues there for their collaboration. The series of trials covers the following topics:
Experiment 1. Potential growth in modern strains.
Experiment 2. Responses to protein (1).
Experiment 3. ME:CP rations and protein utilization.
Experiment 4. Responses to protein (2).
Here some of the results of Experiment 1 are presented
Materials and methods
Full details of the trial will be found in Gous et al. (2019a and b). Briefly, groups of BUT 6 and Hybrid Converter poults were housed in littered pens with 30 males or 40 females per pen. The trial started in April 2013. Feeding was to Aviagen recommendations for the BUT 6 and a conventional, hopefully close to thermoneutral, environment was provided with brooders offering some temperature gradient up to 28 days of age. Day length was reduced from 24h to 17h at 8 days and then maintained at this level. Light intensity was 80 lux to day five and 5 lux thereafter. At intervals during the trial sample birds were sacrificed to determine feather weight, yield of body components and the overall chemical composition of the feather-free body.
Potential growth was analysed using the Gompertz growth curve which has three parameters and the following form.
Weight = A*exp (-exp (-B*(X-t*))); where A = mature or maximum asymptotic weight, B is a dimensionless rate coefficient, t* is the age at the point of inflection on the growth curve and X is age in days.
The allometric relationship between two animal characteristics x and y, is given by the equation y=ax^b. This is determined by converting x and y to logarithms to give a linear equation:
logy = a +b*logx.
Results: bodyweight
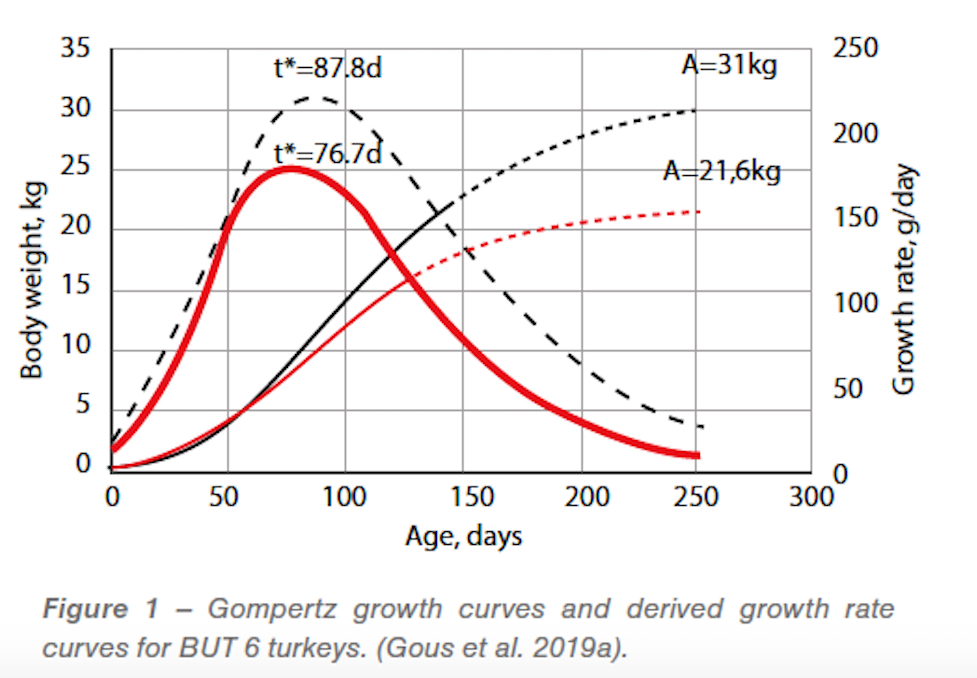
The Gompertz growth curves calculated for BUT 6 turkey males and females, and their first-order derivatives i.e. growth rate (g/d), are shown in Figure 1 and the data for all breeds in Table 1. The asymptotic bodyweight for BUT males and females were 31.0 and 21.6kg respectively. Maximum growth rates of about 215g/d (males) and 177 g/d (females) were reached at about 88 and 77 days. The growth rate coefficient. B, was higher in females, 0.0223, than in males, 0.0189. Table 1 shows that the two strains used were similar; the numerical differences observed are mostly explained by statistical uncertainty.
INSERIRE FIGURA 1
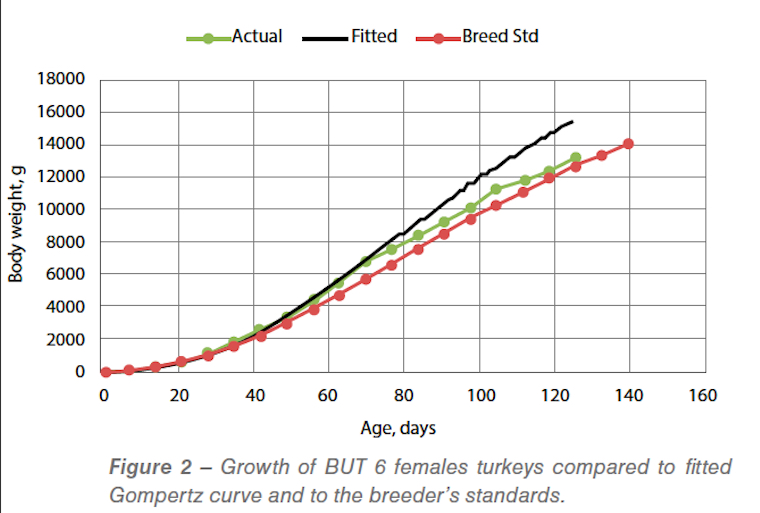
Examination of the data allowed us to sustain the argument that the turkey males had grown close to their potential. For the turkey females however we had to conclude that after about 70 days of age potential growth had not been achieved. This is illustrated in Figure 2 for BUT turkey females; the data were almost identical for the HYB females. Up to 70 days the birds grew on a smooth trajectory which was accurately described by the Gompertz curve. But after that age growth slowed significantly relative to the earlier trajectory and was approaching an asymptotic weight of about 16kg. This compared with 21.6kg calculated from the trajectory up to 70 days. The point cannot be proved but we chose to interpret the observed growth of the females as being below potential after 70 days of age and attributed this to the higher stocking density used in the female pens. It is interesting that in both strains the breeders’ standards also follow this reduced growth trajectory after about 70 days of age.

Results: Feather growth
Feather growth has always been a problem for modelling. Feathers use a significant amount of nutrients (especially amino acids) in their growth but more importantly they influence heat loss to the environment and this influences feed intake. Feather growth occurs in a series of successive phases with a moult and regrowth separating each phase. Because feathers are difficult to study we have a serious lack of good quantitative data about their growth in modern poultry species. In this experiment we found a single allometry between feather weight and body protein weight. This is a useful observation for modellers because previously it had been thought that a single allometry did not exist. Interestingly similar new results have just been produced for quail.
Results: Chemical body composition
In order to make nutritional calculations we need to go beyond seeing growth just in terms of bodyweight. We do this by considering the four major chemical elements in the feather-free body: moisture, protein, ash and fat.
As expected, we found linear allometric relationships between body water and ash and body protein. The ratios between these components at maturity were consistent with those reported previously for turkeys and for broilers. Body fat, which in birds growing at their potential is also expected to be related to body protein, was more difficult to interpret. Firstly the plot of lipid content of the body plotted against age is shown in Figure 3.
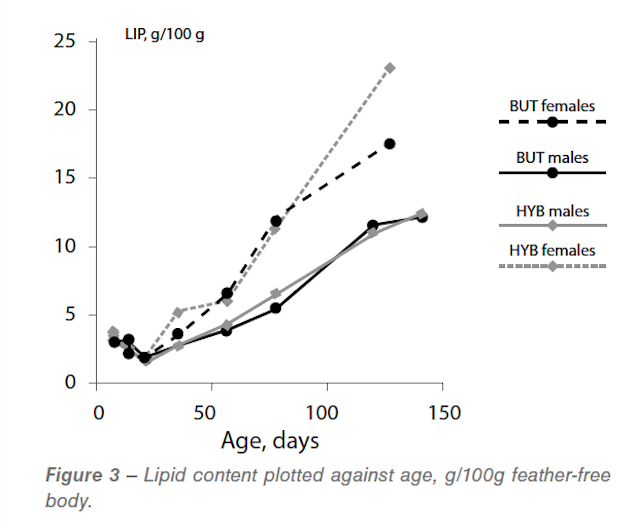
As expected the females were much fatter than the males after about 35 days of age. Less expected was the decline in fat content of the body between 7 and 21 days. This pattern has been observed before by Leeson and Summers (1980) and it may reflect the potential growth for lipid in turkeys. If this is the case then turkeys differ from other species; pigs, broilers, ostrich, that have been studied. The other possibility, which we prefer but which cannot be proven from these data, is that the birds suffer an energy deficiency in the early stages due to the high protein content of the feed. This is the topic discussed in Experiment 3 of this series.
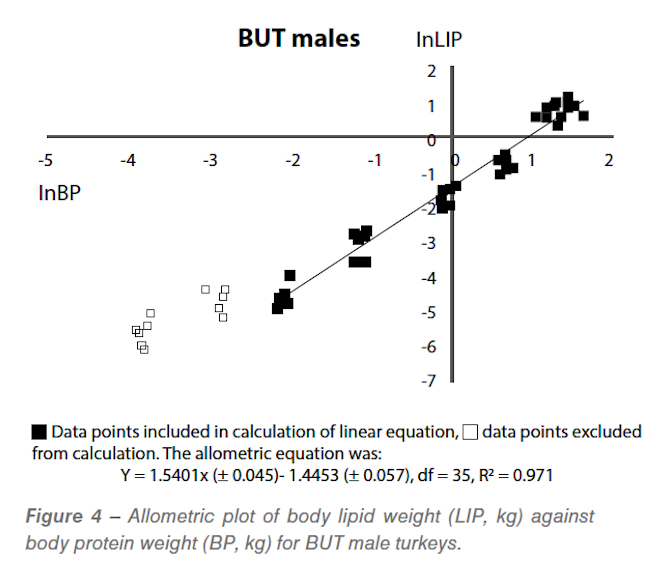
Because the turkey females were not growing at their potential after 70 days of age we cannot assume that the levels of lipid shown in Figure 3 represent the potential (genetically determined) fatness of these birds and no further analysis has been done. The allometric plot for BUT males is shown in Figure 4.
Because body fat levels declined in the early stages of growth whilst body protein increased there cannot be a single allometry between these two characteristics. However, starting with the sampling at 14 days, a single straight line seems to describe the data well and these results have been used to estimate the body fat at maturity. These data lead to estimated lipid:protein ratios at maturity of 0.71 in BUT males and 0.76 in Hybrid males. These are significantly lower than the value of 1.0 estimated from earlier work – testament to the successful breeding of leaner turkeys.
Results: Predicting body parts
The turkey weights of breast, breast skin, drum, drum skin, thigh, thigh skin and wing-plus-skin as well as the head, neck, feet, blood, heart, liver and gizzard were measured at different stages of growth. Using the weights of the components and the protein content of each bird the allometric relationships between the components and body protein were determined and then compared for each strain x sex combination.
In general allometric equations were successful predictors of most body parts. In some cases, e.g. breast and blood in the carcass a single equation could be used for both breeds and sexes. Where separate equations were required these were frequently between males and females and appeared to reflect the higher levels of fat in the females. As in broilers, early breast weights are not linearly related to body protein but if the data from day-old and 7-day old birds are omitted then a close linear prediction equation is found.
References are available on request


