

Part 2: Dynamics at continent and country level in detail
While the analysis in Part 1 dealt with the continents and the leading countries in egg trade more general, the following chapter will analyze the dynamics in the continents at country level in more detail.
Europe is dominating global egg trade
As could be shown, Europe held a dominating position in global egg exports as well as in imports during the analysed decade. In 2016, the continent shared almost 61 % in exports as well as in imports.
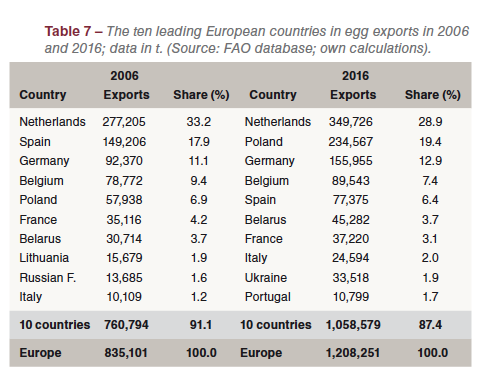 Between 2006 and 2016, European egg exports increased by 373,150 t or 44.7 %. Table 7 shows that Poland hadthe highest absolute and relative increase with over 176,000 t or 304.9 %. Its share in European egg exports grew from 6.9 % in 2006 to 19.4 % in 2016. The second highest absolute growth was to be found in the Netherlands with 72,521 t, followed by Germany (+ 63,585 t) and Belarus (+ 14,514 t). In contrast to these four countries, Spain lost 71,831 t or 48.1 % in exports in the analysed time period. While the country ranked in second place behind the Netherlands in 2006, it fell to the 5th rank in 2016, losing 11.5 % of its former share because of Germany´s lower imports from 2012 on. It is also worth noting that Belarus and Ukraine could strengthen their position in European egg exports.
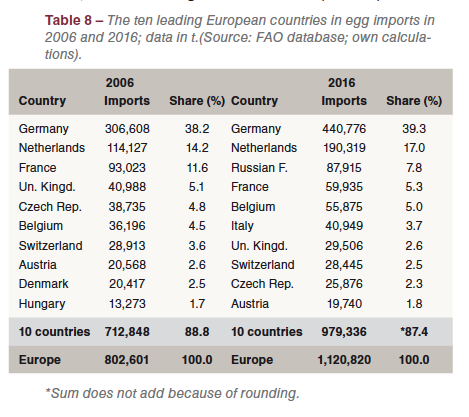 In the analysed decade, European egg imports increased by 39.6 %, about 5 % less than the export growth. Germany´s imports grew by over 134,000 t or 43.8 % despite the considerable increase of the domestic production by 70,000 t. The higher domestic demand because of an increase of the per capita consumption from 209 eggs in 2006 to 235 eggs in 2016 was the main reason for this development.
A similar dynamics can be observed in Russia. Imports grew considerably because of the constantly increasing per capita consumption from less than 260 eggs in 2006 to 295 eggs in 2016. Egg imports by the Netherlands fluctuated in the analysed time period. A peak was reached in 2013 with over 263,000 t. This level could not be maintained although in 2015 and 2016 shell eggs for further processing and egg products were exported to the USA. The regional concentration of egg imports in Europe is very high. The two leading countries, Germany and the Netherlands shared 56.3 % of the total import volume in 2016, the ten leading countries 87.4 % (Table 8).
Asia´s growing production is reflected in higher trade shares
It could be shown in Part 1 that Asian countries gained in importance in egg exports and imports. This dynamics reflects as well the increasing efficiency of the egg industry as the growing demand in an expanding middle class with a higher purchasing power.
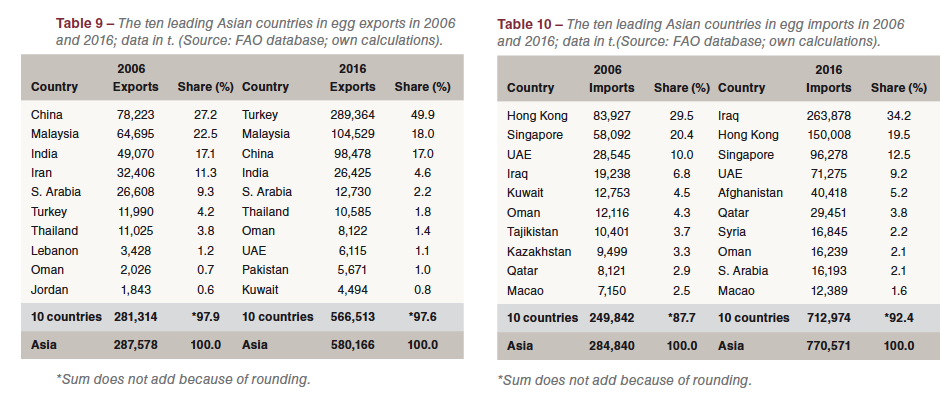
A comparison of the composition and ranking of the ten leading Asian countries in egg exports in 2006 and 2016 reveals some remarkable developments (Table 9). In 2006, Turkey exported less than 12,000 t of shell eggs, sharing 4.2 % of the total export volume of the continent. In 2016, exports surpassed 289,000 t, equaling almost half of Asia´s export volume. This remarkable dynamics is a result of the implementation of highly-efficient production systems in vertically integrated companies. They were not only able to supply the domestic market but also to develop markets for the continuously growing surplus. In 2016, Turkey ranked in second place behind the Netherlands regarding egg exports. Malaysia was able to expand its egg exports by almost 40,000 t or 61.6 %. The export surplus was mainly targeted at Singapore. India´s export volume decreased by 22,754 t or 46.1 %, a result of the growing domestic demand because of a sharp increase of the per capita consumption from 38 eggs in 2006 to 66 eggs in 2016.
Egg imports by Asian countries grew by 485,731 t or 170.5 % (Table 10). The increase was about 50 % higher than that of European countries. A comparison of the composition and ranking of the ten leading importing countries in 2006 and 2016 again reveals a remarkable dynamics. The composition of the four leading countries did not change, but their ranking did. Iraq jumped from fourth to first place with an absolute growth of the import volume by 244,640 t, a result of the Iraq war and the almost completely destroyed egg industry. Egg imports also grew considerably in Hong Kong the United Arab Emirates and Singapore. In the three countries, demand grew much faster than domestic production.
The dynamics of egg exports and imports in Asia differed considerably from that in Europe. While the internal trade in Europe, especially among EU member countries, remained fairly stable with the exception of the changes in Eastern Europe, egg trade in Asia is developed very fast. This is true as well for egg exports, where Turkey was the main winner, as for egg imports, where the political and economic instability in several countries and the growing demand because of the higher egg consumption in others resulted in a remarkable dynamics and the development of characteristic trade flows which will be analysed in Part 4.
Egg trade in the Americas was dominated by a few countries
 In 2016, countries of the Americas contributed only 7.8 % to global egg exports and 6.1 % to global imports. Besides Europe it was the only continent with production surpassing demand.
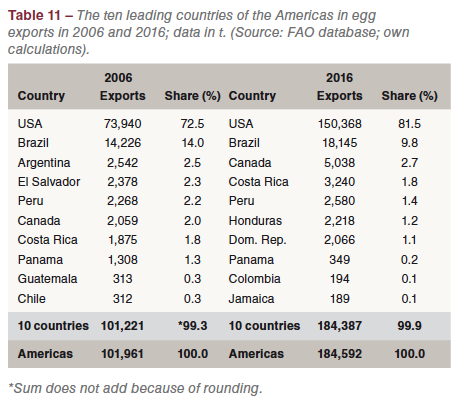
Between 2006 and 2016, egg exports increased by 82,631 t or 81.0 % (Table 11). With the exception of the USA, exports of all other countries were of minor importance. In 2016, the USA shared 81.5 % of the total export volume of the Americas, 9.0 % more than in 2006. In second place ranked Brazil with a share of 9.8 %. The regional concentration was extremely high, for 99.9 % of all exports were contributed by only 10 countries.
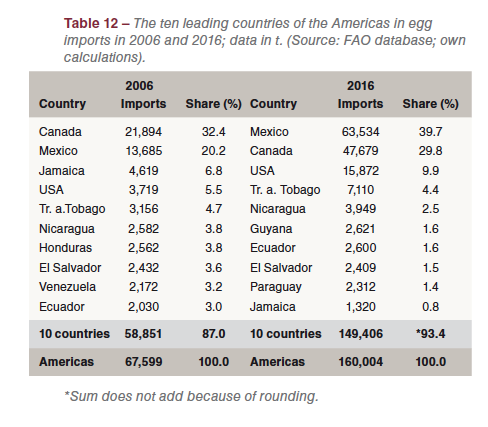 Egg imports by countries of the Americas grew by 92,400 t or 136.7 %. A detailed analysis of the dynamics between 2006 and 2016 reveals that Mexico´s imports increased by more than 49,500 t, a result of the various outbreaks of the Avian Influenza virus. Canada also increased its imports while those of the USA fluctuated considerably. A peak was reached in 2015 with 54,945 t, almost 45,000 t higher than in the preceding year. The considerable growth was a result of the Avian Influenza outbreaks in the Midwest in 2015. Once the repopulation of the affected farms was completed, the export volume fell back to normal values (Table 12).
African countries played only a minor role in global egg trade
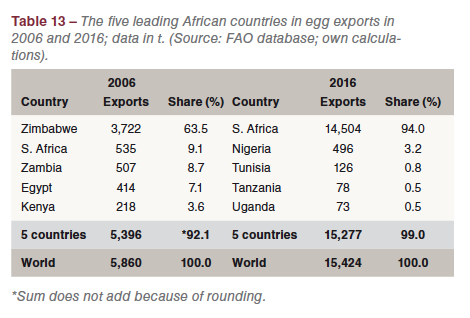 African countries played only a minor role in global egg trade. In 2016, they shared 0.8 % of the global export volume and 2.5 % of the imports. Table 13 documents that the composition and ranking of the exporting countries changed considerably. South Africa ranked in an unchallenged first place in 2016, contributing 94 % to the total exports. Obviously, egg farmers in South Africa were able to increase their production considerably and besides supplying the domestic market could export 14,500 t of shell eggs.
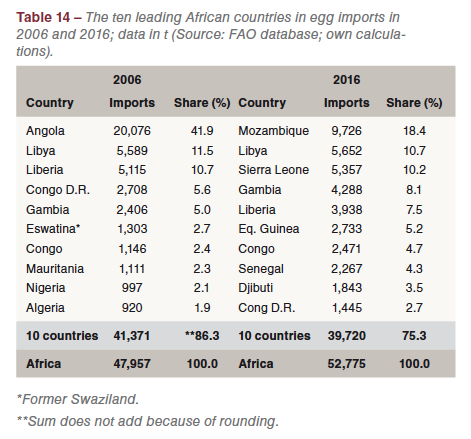 Egg imports of African countries only increased by 4,818 t or 10.0 % in the analysed decade. The regional concentration in 2016 was lower than in 2006, indicating that a growing number of countries imported eggs to meet the domestic demand. With the exception of Libya all countries listed in Table 14 were located south of the Sahara.
Oceania – low population and peripheral location limited egg trade
Although the volume of egg exports doubled between 2006 and 2016 and reached a volume of 2,444 t, Oceania contributed only 0.1 % to the global egg trade. New Zealand ranked in first place with a share of 76.2 % of Oceania´s export volume, followed by Fiji and Australia.
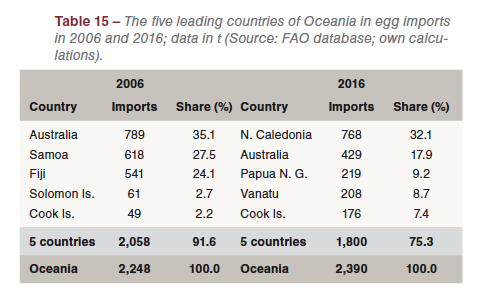 The data in Table 15 documents that egg imports of countries in Oceania only grew by 6.3 %. While the imports of Australia fell by 360 t, New Caledonia´s import increased by 720 t or 1,500.0 %. In total, the volume of traded eggs was very small, a consequence of the low population, the peripheral location and the long transportation distances. Australia would be able to produce larger amounts of eggs based on domestic feed resources, but the long distances to major markets in East and Southeast Asia restrict such activities.
The main results of the first two parts of this analysis can be summarized as follows:
- Only 2.7 % of global egg production was traded in 2016. The fact that shell eggs cannot be deep-frozen limits transport distances.
- Global egg trade grew much faster than production, indicating that many countries were not able to meet the increasing demand by domestic production and the fact that eggs are becoming more and more attractive as a high-value protein source.
- European and Asian countries dominated global egg trade. In 2016, European countries contributed about 61 % to global exports and imports, Asian countries shared 29.1 % of the exports and 36.6 % of the imports.


