At their meeting this year in August in South Africa, the current five BRICS member countries decided to admit six more countries on January 1st, 2024. These are Egypt, Argentina, Ethiopia, Iran, Saudi Arabia and the United Arab Emirates. With this expansion, the new grouping aims to create a political and economic counterweight to the West. This paper will examine what this means for the world poultry industry.
Hans-Wilhelm Windhorst – The author is Professor emeritus of the University of Vechta, Germany
Since the grouping has not yet given itself a new acronym, it will here be referred to as BRICS+.
Population and economic power of the BRICS+
The planned enlargement will increase the population of the grouping by 414.3 million and bring it to 3,677.3 million, which corresponds to 46.0% of the world population. Of this, China and India alone will account for 2.8 billion or 35.7%. As can be seen from Table 1, China will be the leading economic power, accounting for 17.8% of global value added alone. It has a share of 60.6% in the gross national product of BRICS+. All other member countries fall far behind. It can be assumed that China will decisively determine the further strategies of the alliance in the future.
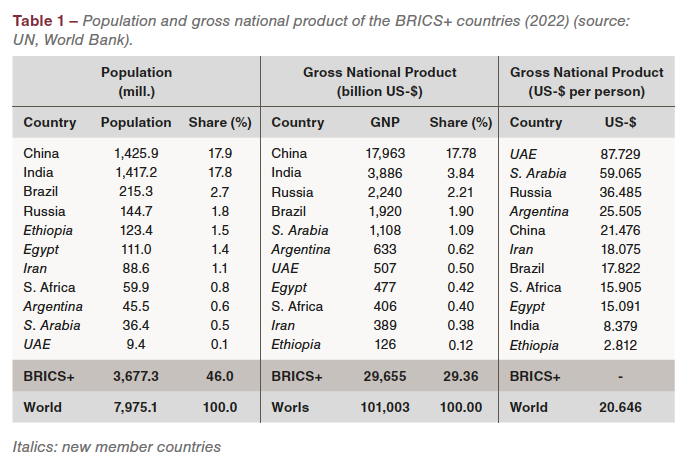
There are great differences in terms of value added per person and thus in purchasing power. Based on the extensive oil and gas reserves, the United Arab Emirates and S. Arabia occupy a top position. The gap to the next three countries, which are still above the world average, is considerable. In comparison, the value added per person is very low in India and Ethiopia. They expect to benefit from the merger in terms of economic development and trade relations.
High shares in the global production of poultry meat and eggs
A comparison of the shares of BRICS+ in world production of poultry meat and eggs with those of the EU (27) and the USA in 2021 shows the strong position of the group (Table 2).
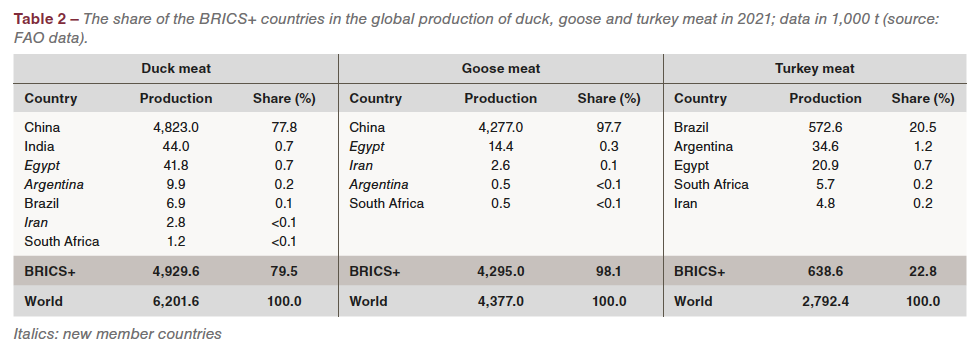
Breaking down the BRICS+ shares by country (Figure 1), the special position of China and Brazil in poultry meat production becomes obvious. Together, they accounted for 28.2% of world production in 2021, more than twice that of the EU (27) and 11.4% more than the USA. They accounted for 68.5% of BRICS+ production volume. It should be emphasised that S. Arabia and the United Arab Emirates, which have a high demand for poultry meat, produce only small quantities domestically.
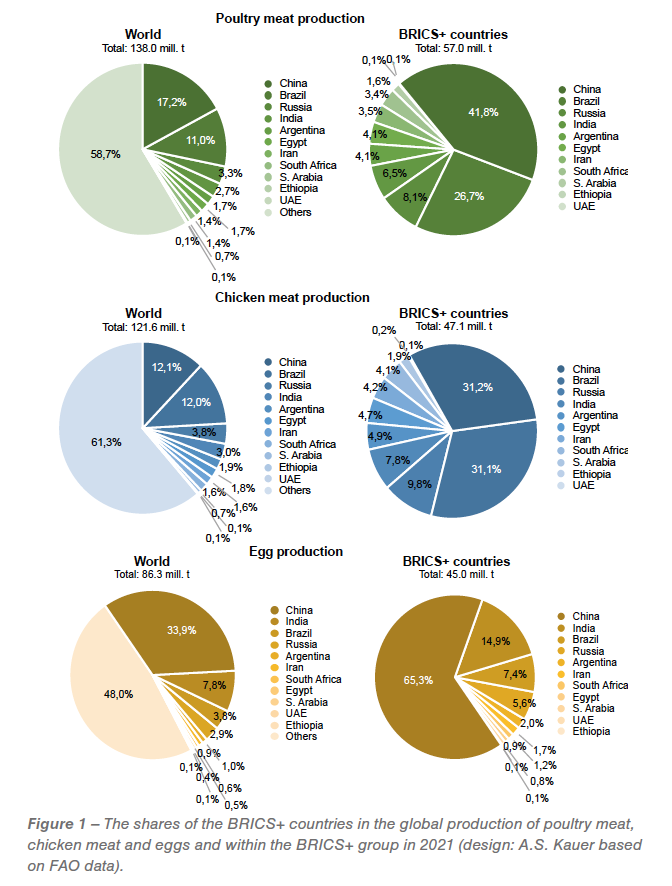 BRICS+ contributed 38.5% to the global production of chicken meat, the most important poultry product. Again, China and Brazil held the two leading positions. Together they accounted for 24.1% of world production, more than double the EU (27) and 7.0% more than the USA. They accounted for 62.3% of total production in the group. All other countries were far behind. Which role the member countries of BRICS+ played in world trade with poultry meat is examined in the next section.
In 2021, BRICS+ contributed 52.0% to the global production of shell eggs, with China alone accounting for 33.9%. Only India, Brazil and Russia had considerable production volumes. Together, the three countries accounted for 14.5% of global production, almost double that of the USA and the EU (27). Because shell eggs cannot be frozen, the volume traded is far below that of the USA and the EU (27).
The BRICS+ countries played a prominent role in the production of duck and goose meat. As can be seen from Table 3, this is solely due to China’s large production volumes. Only small quantities were produced in the other member countries. Regarding turkey meat, the contribution to world production was much smaller, with only Brazil achieving a considerable share of 20.5%. In the other countries, only small quantities or no turkey meat were produced, which is due to the low per capita consumption.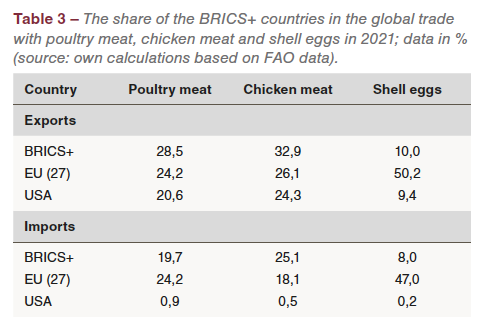 Large differences in shares of world trade in poultry meat and eggs
The shares of BRICS+ countries in exports and imports of poultry meat and eggs in 2021 showed large differences (Table 3).
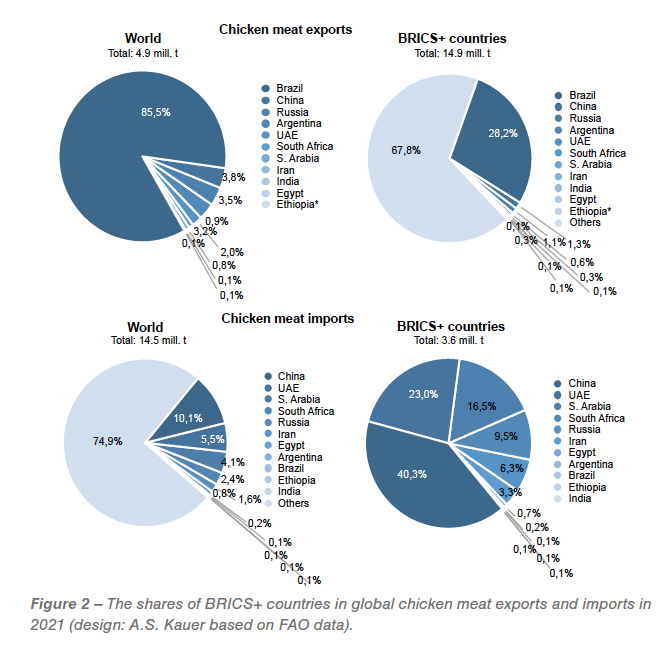
The high share in poultry meat exports is mainly due to Brazil’s role in chicken meat trade. There, as can be seen from Figure 2, it represented 28.2% of the world exports. The USA, which ranked second in world trade of this meat type, was only slightly below the EU’s share (27). Shell eggs were mainly traded within the EU (27). Here, the USA and the BRICS+ countries had almost equal shares. However, a detailed analysis would show that the trade flows differed significantly.
 .
.
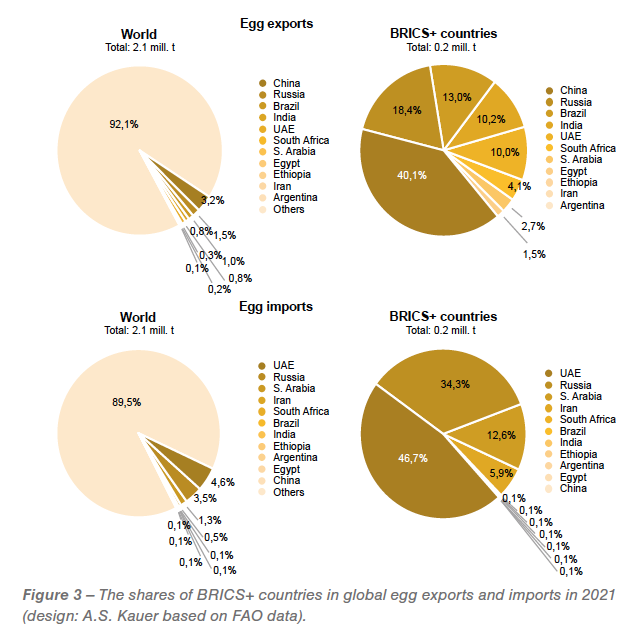
Chicken meat was mainly imported by China, the United Arab Emirates, S. Arabia, South Africa and Russia. Together they accounted for 24.0% of world imports. The volume of egg imports was low for the reasons already mentioned. A total of only about 211,000 t were imported by the BRICS+ countries, of which 93.8% were accounted for by the United Arab Emirates, Russia and S. Arabia. All other countries, apart from Iran, imported only very small quantities, in some cases less than 1,000 t (Figure 3).
Summary and outlook
The preceding analysis could show that the expansion of BRICS will lead to an even stronger position of the group in the world poultry economy. In 2021, the BRICS+ countries accounted for more than half of the world’s egg production, over 41% of poultry meat and 38.5% of chicken meat. The degree of regional concentration within the grouping was very high. China and Brazil dominated in poultry meat, and China and India in eggs.
The BRICS+ countries accounted for almost one-third of global trade with chicken meat in 2021, but this was mainly due to Brazil’s high export volume. The shares of the other countries were comparatively low, with only China, Russia and Argentina each accounting for more than one percent of global exports. The share of the BRICS+ countries in global chicken meat imports was much lower with 25.1%. China had the top position here, followed by S. Arabia, the United Arab Emirates, South Africa, Russia and Iran.
Because shell eggs cannot be frozen, comparatively small quantities were traded. The BRICS+ countries shared only 8.0% in global exports and 10.0% of imports. China, Russia and Brazil led in exports, the United Arab Emirates, Russia and S. Arabia in imports. The countries on the Arabian Peninsula were attractive markets for both chicken meat and shell eggs. Regional concentration was also very high for imports of chicken meat and shell eggs. The United Arab Emirates and China accounted for 63.3% of the group’s chicken meat imports; the United Arab Emirates and Russia for 81.2% in shell egg imports.
In their long-term forecasts, the US Department of Agriculture and the OECD-FAO assume that both egg and poultry meat production will show high absolute and relative growth rates in the coming decade. Development is likely to be particularly dynamic in emerging and developing countries, which are forecast to account for nearly 81% of the increase in production of shell eggs and 79% of that of poultry meat. Of the projected increase in egg production from 92.5 million mt to 103 million mt, only about 2 million mt are expected to come from the industrialized countries and 8.5 million mt from the emerging and developing countries. In Asia, production will increase by 7.3 million mt. China and India together will account for 4.5 million mt.
World production of poultry meat is expected to increase by 19.7 million mt, in Asia alone by 10 million mt and in Latin America by 4.5 million mt. Production in the industrialised countries is expected to increase by 4 million mt, and by 15.7 million mt in the emerging and developing countries.
The OECD-FAO Agricultural Outlook expects world trade in poultry meat to increase from 15.7 million mt, the average in 2020-2022, to 16.5 million mt, or by 5.1%. While only a little change is expected in the trade volume of industrialized countries, an increase from 8.2 million mt to 9.0 million mt is forecast for developing countries. Latin America and Asia will account for roughly equal shares. Poultry meat imports are predicted to increase by nearly one million mt. Of this, developing countries will account for 720,000 mt. Imports from African countries will increase by about 500,000 mt, those from Latin American countries by 200,000 mt. No projections are provided on the development of world egg trade.
Data sources and supplementary literature
FAO Database https://www.fao.org/faostat/en.
OECD-FAO Agricultural Outlook 2023-2032 https://www.oecd.org/publications/oecd-fao-agricultural-outlook-19991142.htm.
USDA: Agricultural Projections to 2032 https://www.ers.usda.gov/publications/pub-details/?pubid=105852.
Windhorst, H.-W.: The role of BRICS countries in global egg production and trade. In: Zootecnica International 37 (2015), no. 6, p. 20-25.
Windhorst, H.-W.: Patterns and dynamics of global egg and poultry meat trade. Part 1: Egg trade. In: Zootecnica International 44 (2022), no. 2, p. 22-28.
Windhorst, H.-W.: Patterns and dynamics of global egg and poultry meat trade. Part 2: Poultry meat trade. In: Zootecnica International 44 (2022), no. 3, p. 24-27.
Windhorst, H.-W.: Patterns and dynamics of global egg and poultry meat trade. Part 3: Chicken and turkey meat trade. In: Zootecnica International 44 (2022), no. 4, p. 36-40.
Windhorst, H.-W.: Patterns of the poultry industry in the MEA region: Part 1. Egg production and trade. In: Zootecnica International 44 (2022), no. 7/8, p. 30-33.
Windhorst, H.-W.: The remarkable dynamics of the global poultry industry: 50 years in retrospective. Part 1 – Global egg production and trade. In: Zootecnica International 45 (2023), no. 6, p. 20-28.
Windhorst, H.-W.: The remarkable dynamics of the global poultry industry: 50 years in retrospective. Part 2 – Global poultry meat production. In: Zootecnica International 45 (2023), no. 7/8, p. 24-33.
Windhorst, H.-W.: The remarkable dynamics of the global poultry industry: 50 years in retrospective. Part 3: Global poultry meat trade. In: Zootecnica International 45 (2023), no. 9, p. 22-31.


