In June 2021, FAO published an update on global trade data for 2019. This makes it possible to present an overview on the patterns and dynamics of global egg and poultry meat trade. In a first paper, egg trade will be analysed, a second paper will deal with poultry meat trade, a third will focus on chicken meat and turkey meat.
Hans-Wilhelm Windhorst – The author is Professor emeritus at the University of Vechta and visiting Professor at the University of Veterinary Medicine, Hannover, Germany
Patterns of egg production at global and continent level
A short overview on the development of global egg production between 2009 and 2019 and the share of the continents will be given to better understand the following analysis of the dynamics and patterns of egg trade.
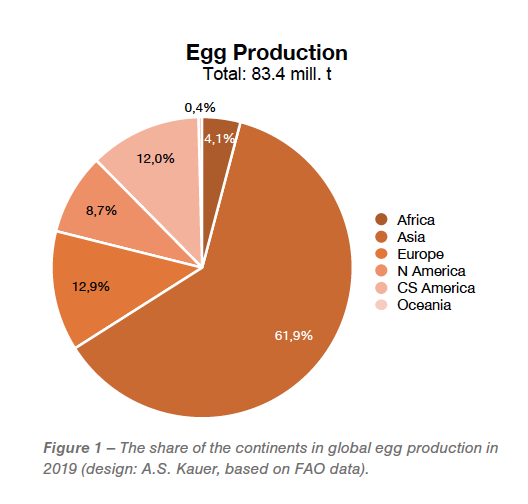
Between 2009 and 2019, global egg production increased from 62.9 mill.t to 83.5 mill. t or by 32.7%. Figure 1 documents the high regional concentration in production. Asia contributed 61.9% to the global production volume, followed by Europe and Central and South America.
Table 1 shows the share of the exported eggs in egg production at continent level. Of the 83.5 mill. t of eggs which were produced in 2019, only 2.3 mill. t or 2.8 % were exported. This is a low share in comparison to 15.2% in poultry meat.
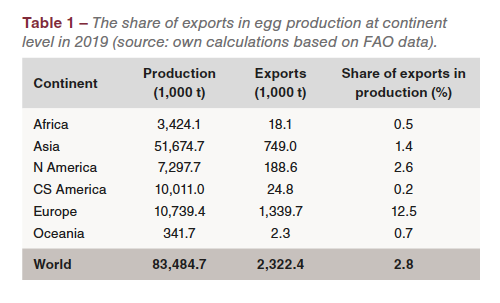 A detailed analysis of the situation at continent level reveals remarkable differences. The highest share of egg exports in production showed Europe with 12.5%. This documents the surplus of production over consumption in several member countries of the EU (27). In all other continents, the share of exports was much lower. At first sight, it may be surprising that only 0.2% of production was exported by Central and South American countries. This results from the fact that most of the eggs were produced for domestic consumption. One has also to consider that eggs cannot be deep-frozen, have a short shelf-life and cannot be shipped over long distances.
Egg imports grew faster than exports
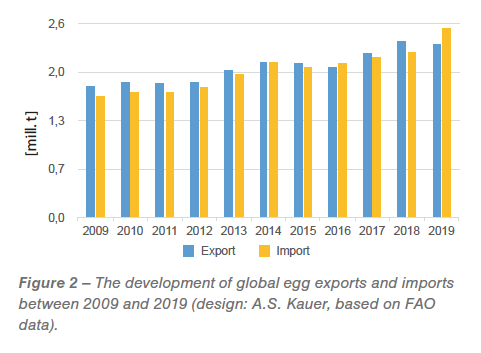 Global egg trade showed a remarkable dynamics between 2009 and 2019. Figure 2 documents the development of the export and import volumes in the analysed decade. The export volume grew by 557,325 t or 31.6%, the import volume by 916,053 t or 56.3%. It is worth noting that the export volume remained almost stable between 2018 and 2019 while the import volume increased by 315,000 t. The highest absolute growth in imports showed Afghanistan, Hong Kong, the Netherlands and the United Arab Emirates. The fact that the imports were considerably higher than the exports may have an explanation in the high export surplus in 2017 and 2018 over the imports, which was then traded in 2019.
Europe and Asia dominated egg trade
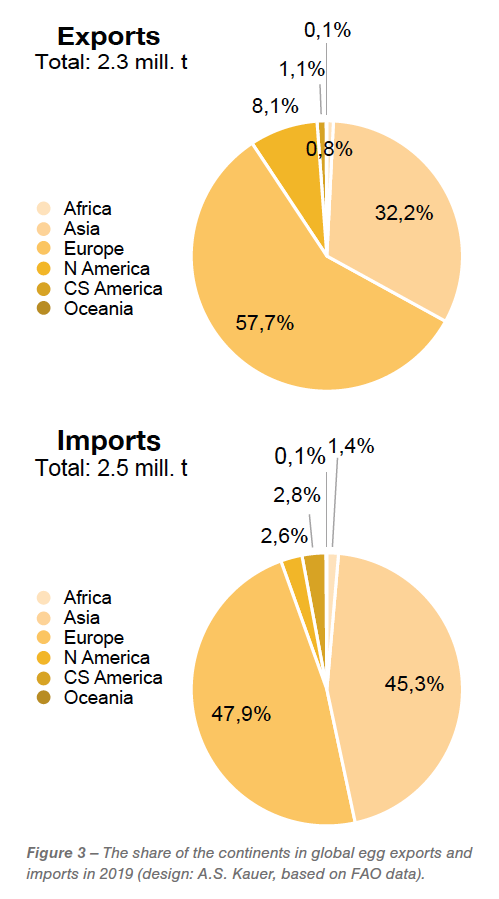 The regional concentration was extremely high in egg exports and imports. Figure 3 documents that in 2019 57.7% of all eggs that reached the global market was exported by a European country. Together with Asia, the two continents contributed almost 90% to the world exports. North America ranked in third place with a share of 8.1%. The regional concentration was even higher in imports. European and Asian countries together imported 93.1% of all traded eggs, the Americas only 5.4%. The high contribution of Europe to the export volume is a result of the self-sufficiency rate of 105% of the EU (27). The fact that European countries also rank in first place in imports is due to the considerable intra-EU trade. In a later part of the analysis, this will be documented.
High regional concentration in egg exports and imports
In 2019, the ten leading egg-exporting countries shared 75.9% in the global export volume. Table 2 lists the ten leading countries and their contribution to global egg exports.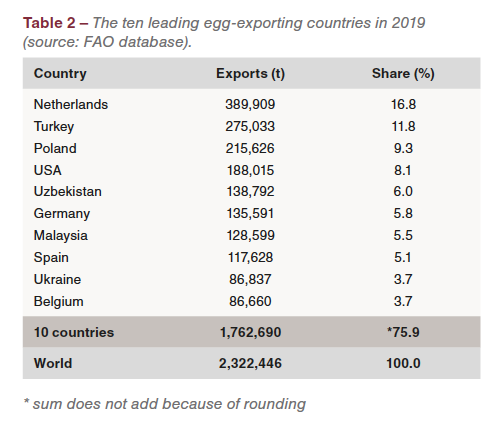
While the Netherlands have been the country with the highest export volume for many years, Turkey and Poland became major exporting countries during the past decade. The Turkish egg exports increased from only 90,000 t in 2009 to 361,000 t in 2018. In 2019, the exports fell to 275,000 t due to the sharp reduction of exports to Iran, Iraq and Saudi Arabia. It could not be compensated by increasing exports to Syria, Kuwait and Qatar. Poland’s egg exports grew from 142,000 t in 2009 to 265,000 t in 2017 and then decreased to 216,000 t in 2019. Outbreaks of the Avian Influenza virus in 2019 (Smietanka et al. 2020) not only caused the culling of flocks and a production decrease but also import stops by major countries of destination for egg exports.
 A comparison of egg production and egg exports at country level permits some interesting insights (Table 3). The Netherlands, Belgium, Poland and Uzbekistan showed the highest share of exports in production whereas the USA and Ukraine exported only a small amount of their production. A detailed analysis of the trade flows would reveal that the Netherlands, Belgium and Poland exported most of their eggs to other EU member countries. With a share of 68.6% in the total export volume, Germany was the leading country of destination for the egg exports of the Netherlands and ranked second after the Netherlands in Poland’s exports with a share of 26.2%. No data of the trade flows is available for Uzbekistan.
 The regional concentration in egg imports was also very high. Table 4 lists the ten leading egg-importing countries in 2019. They contributed 76.8% to the global import volume. Germany ranked in first place with a share of 17.1%, followed by Iraq, the Netherlands and Hong Kong. Germany has been the leading egg importing country for several decades. In 2019, 72.9% of its imports came from the Netherlands, followed by Poland (14.8%), Belgium (2.8%) and Denmark (2.6%). The close trade relations between the Netherlands and Germany are obvious. At first sight, it is surprising that Germany also ranked among the leading egg-exporting countries despite a self-sufficiency rate of only 70.5% and that 59.3% of the exports were destined for the Netherlands. The reason is that Dutch farmers and egg companies own large egg farms in Eastern Germany. They sent most of their production back to the Netherlands and they appeared in the trade statistics as exports from Germany and imports by the Netherlands, which explains its third rank among the leading egg-importing countries. With a share of 68.6% in the total export volume, Germany was the leading country of destination for the egg exports of the Netherlands and ranked second behind the Netherlands in Poland’s exports with a share of 26.2%. A similar bilateral trade relation has developed between Malaysia and Singapore. In 2019, 85.7% of Malaysia’s exports were destined for Singapore and 90.5% of Singapore’s imports came from Malaysia. Short distances were the decisive steering factors for the intense trade relations.
Summary and perspectives
In 2019, only 2.8% of the global egg production was exported. As shell eggs cannot be deep-frozen and have a relatively short shelf life, they were mainly traded only over short distances. Europe and Asia were the dominating continents in egg trade, in the other continents trade with shell eggs was only of minor importance. The regional concentration was also very high in exports as well as in imports with a share of roughly 76% of the ten leading countries in the global trade volume. Remarkable bilateral trade relations existed between the Netherlands and Germany and between Malaysia and Singapore.
As eggs will be one of the most important protein sources for the growing global population also in future, egg production will further increase in the coming decade and new trade relations may develop, if not with shell eggs, then perhaps with egg products. Alternative plant-based egg replacers will gain in importance but in the foreseeable future only gain small market shares.
Data sources and suggestions for further reading


