
In 2015, the 507 million inhabitants of the 28 EU member countries shared 6.8 % in the global population. The efficiency of the EU poultry industry finds its expression in the contribution to the global production volumes of eggs and poultry meat. In 2015, the EU member countries shared 10.3 % in global egg production and even 11.7 % in world poultry meat production. The EU is so far the only region in which laying hen husbandry in conventional cages is prohibited.
The main goals of this report are:
– To analyse the dynamics of the laying hen inventories and of egg production between 2010 and 2015 in the member countries and the changes in housing systems,
– To document the spatial shifts in egg production and egg trade between 2010 and 2015.
Changes in the EU laying hen inventories and in housing systems
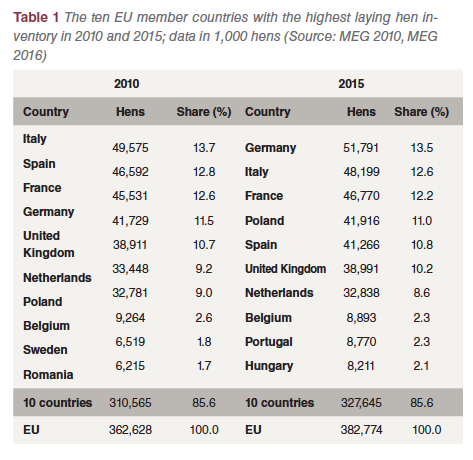 Between 2010 and 2015 the number of laying hens in the EU increased from 362.6 mill. birds to 382.8 mill. birds or by 5.6 %. As can be seen from the data in Table 1, the four countries with the highest inventories shared over 50 % of the total number of laying hens in 2010 and over 49 % in 2015. The share of the ten leading countries was very stable with 85.6 % over the whole time period. A closer look at the dynamics at country level reveals that the highest absolute increase occurred in Germany with 10.0 mill. and in Poland with 9.1 mill. hens. On the other hand, the inventories in Spain fell by 5.2 mill. hens and in Italy by 1.4 mill. The high absolute growth in Germany is a result of the banning of conventional cages as early as 2010.
 The composition of the ten leading countries also changed in the analysed time period. While Germany only ranked in fourth place in 2010, because of the earlier banning of conventional cages, it ranked as number one in 2015, followed by Italy, France and Poland. Spain lost one position and Sweden was replaced by Hungary.
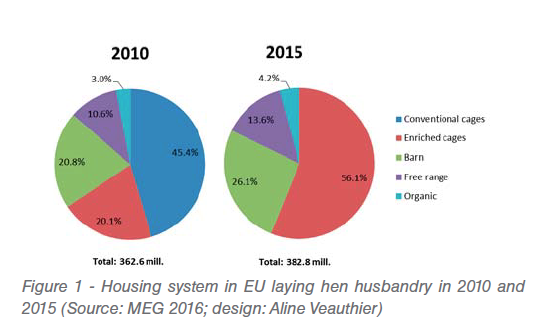
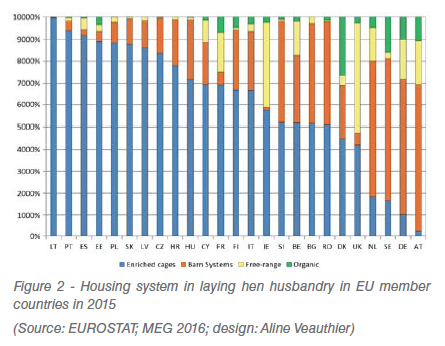 Because of the implementation of Directive 1999/74/EU, conventional cages had to be abandoned in 2012. This changed the composition of the housing systems for laying hens in the EU considerably. In 2010, 45.5 % of the laying hens were still kept in conventional cages and only 20.1 % in enriched cages (Figure 1). Five years later, 56.1 % of the hens were housed in enriched cages, 26.1 % in barn systems, 13.6 % in free-range systems and only 4.2 % in organic systems. Figure 2 shows that the share of the four housing systems differed considerably in the 28 member countries.
Dynamics and spatial shifts in EU egg production
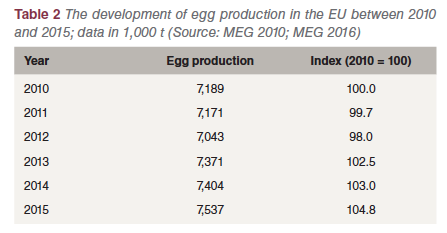 From the data in Table 2 one can see that the last phase of the transformation of the housing systems led to a decrease of egg production between 2010 and 2012 by about 150,000 t or 2 %. Once the transformation was concluded, the production volume increased again and was 350,000 t or 4.8 % higher than in 2010. The comparatively low decrease of the production volume during the transformation process is due to the fact that in some countries, especially in Southern Europe, conventional cages were permitted to be used parallel to the newly installed alternative housing systems. The remarkable growth of the production volume since 2012 resulted in an oversupply and a phase of low prices for the egg farmers. To stabilize the situation, placing of pullets was reduced in several countries, at least for a short time, without a lasting success, however.
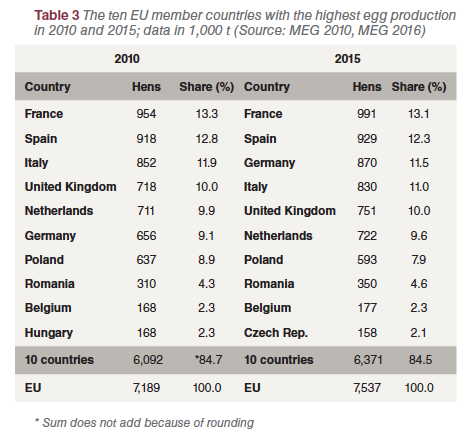 A closer look at the dynamics at country level shows (Table 3) that the regional concentration in egg production was also high even though a bit lower than in the laying hen inventories. The four leading countries shared between 47 % and 48 % in the total production volume of the EU. The contribution of the ten leading countries to the overall egg production in the EU was also very stable; it fluctuated only between 84.7 % and 84.5 % in the analysed time period. The composition of the ten leading countries was also very stable, only Hungary was replaced by the Czech Republic in 2015. In the first four ranks the composition changed, however. In 2010, the United Kingdom had replaced Germany. This was a result of the banning of conventional cages in Germany as early as 2010 and a decrease of the production volume because of the necessary transformation to alternative systems with many empty layer places. In 2015, the four leading countries had stabilized their production again and the old order was re-established.
Dynamics and spatial shifts in EU egg trade
In contrast to poultry meat, shell eggs for consumption are not traded in large amounts and over long distances. Only about 2.9 % of the global egg production is exported respectively imported. Most of the eggs are traded within relatively confined areas. One problem in dealing with the dynamics and patterns of egg trade of the EU is that in some of the available data sets it is not distinguished between the trade between EU member countries and trade with non-EU countries.
Therefore, in this report, only the dynamics and trade patterns of the EU with non-EU countries will be analysed in detail, based on the data, which the Committee for the Common Organisation of Markets of the EU Commission publishes regularly. Another data problem is that this data set includes the eggs equivalents for the exports of egg products. It cannot be decided to what amount shell eggs for consumption or egg products were exported.
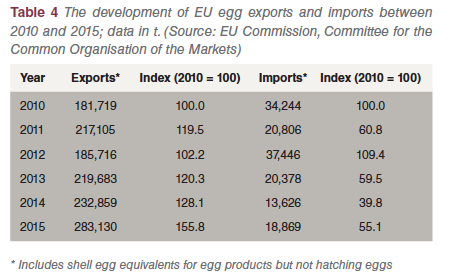 Table 4 shows the development of EU egg exports to non-EU countries respectively EU egg imports from non-EU countries. A closer look at the data reveals the close interdependency between the trade volumes and the implementation of Directive 1999/74/EU. Between 2010 and 2015, egg exports to non-EU countries increased by about 101,000 t or 55.5 %. It was, however, not a continuous increase. The earlier banning of conventional cages in Germany and Austria in 2010 and for the whole EU in 2012 resulted in a decrease of the production volumes. When the transformation to other housing systems was completed, exports increased again. The sharp increase between 2014 and 2015 is a consequence of the oversupply with shell eggs and the rising imports of the USA because of the AI outbreaks in 2015.
A similar dynamics show the egg imports. The decreasing self-sufficiency in Germany, as the leading egg importing country, made additional imports from non-EU countries necessary. The same steering factor explains the increase in 2012 when all countries had to ban conventional cages. When the transformation was completed and production increased again, imports fell to the average level.
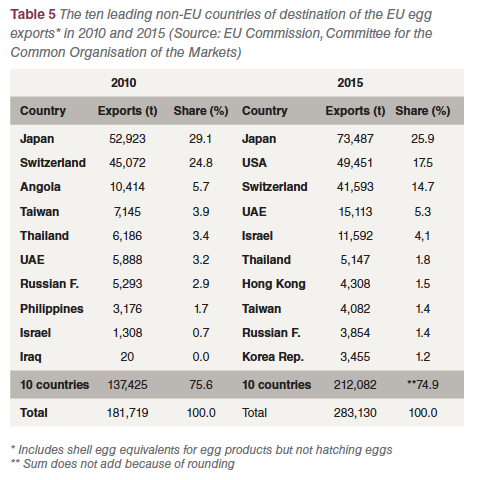 A more detailed analysis of the dynamics at country level shows a remarkable fluctuation in the composition and ranking of the countries. In 2010, 98,000 t or 53.9 % of the total export volume went to Japan and Switzerland (Table 5). In 2015, the USA replaced Switzerland as the second most important country of destination. It can be expected that the exports to the USA was a singular event caused by the shortage of eggs for further processing and of egg products.
For a short time, eggs for further processing as well as egg products were requested by egg processing companies in the USA to fulfil their contracts. The AI outbreaks in the USA also led to a considerable increase of the EU exports to the United Arab Emirates (UAE) and Israel which had in preceding years imported egg products mainly from the USA. Because of the import ban on poultry products from the USA, they had to look for other countries, which could step in. Export data for the first six months of 2016 show that exports to Japan fell considerably, a result of the AI outbreaks in some EU member countries in early 2016.
Compared to egg exports, imports were of minor importance. In 2010, the USA and Argentina ranked as number one and two. Together they shared 74% of the total import volume of 34,000 t. In third place ranked India. All three countries exported mainly egg powder and some eggs for further processing but no shell eggs for consumption. Because of the AI outbreaks and an import ban on poultry products from the USA and the oversupply in the EU, imports decreased considerably in 2015 and only reached a volume of less than 19,000 t.
Imports from India increased and Ukraine became one of the leading countries of origin and could also stabilise its position in the first half of 2016 as more recent data shows. Imports from the USA further decreased because of the imposed import ban by some EU member countries.
The preceding analysis revealed that because of the lack of detailed data on the exports and imports of eggs and egg products it is very difficult to present a complete picture of the dynamics, trade patterns and trade flows. Nevertheless, the presented data give a good overview on the present pattern of the foreign trade of the EU with eggs and egg products.
References are available on request


 in layers")


