
An analysis of regional meat production patterns strikingly highlights the exceptional global and group-level importance of the populous G19 countries. The population and economic output of the EU (27) and the African Union are not included in the following analysis.
The G20 is an informal association of the 19 most important industrialized and emerging economies and the EU (27), with the African Union as an associate member. It was founded in Berlin in 1999, in response to the economic and financial crisis in Asia at the end of the 1990s. The association aims to coordinate economic and financial policies, as well as to exchange information on other policy areas, such as climate change, terrorism, and migration. The presidency rotates annually. A meeting of the respective heads of government, finance ministers, and central bank governors takes place in the country holding the presidency. The agenda is set by the chairman. The goal of the conference is to adopt a final declaration. The objectives adopted there are not legally binding under international law with regard to implementation, but rather should be seen as a voluntary commitment. The objectives are widely implemented and also influence decisions made by the World Bank and the World Trade Organization. The USA will hold the presidency in 2026. It is important to note the different political systems. Alongside democracies, authoritarian systems exist, ranging to dictatorships. Despite these differences, it is usually possible to formulate final declarations that contribute to the economic and financial stability of the global economy.
Significant differences in population size and economic output
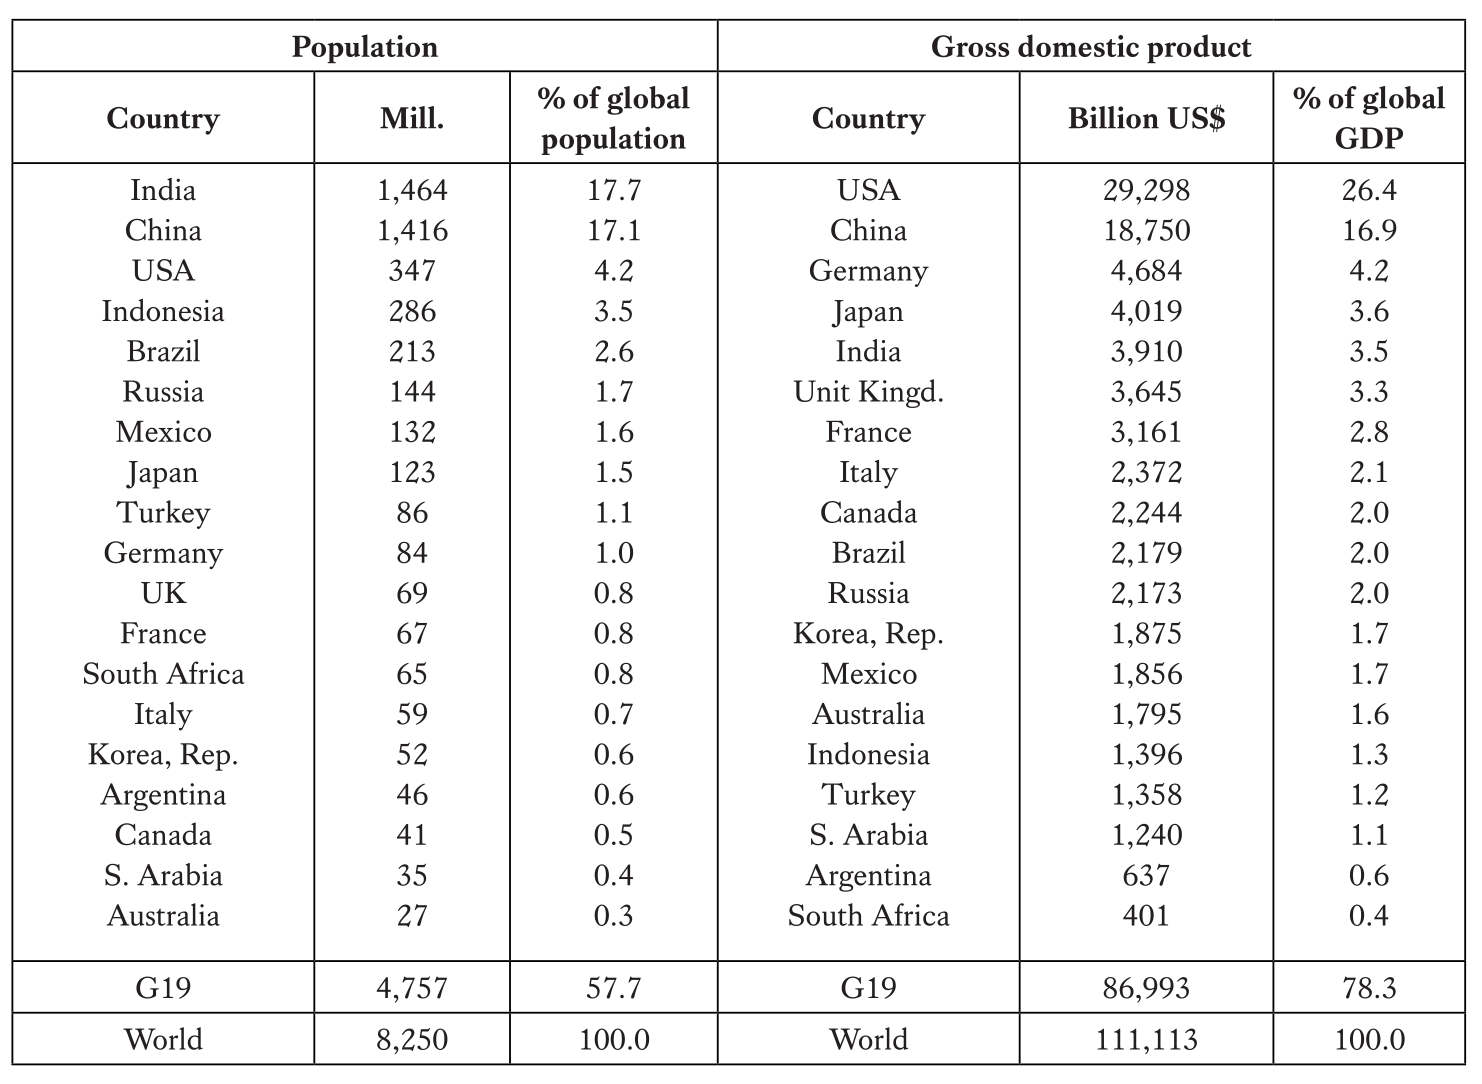
The 19 member countries differ considerably in both population size and economic output (Table 1). In 2025, of the group‘s 4.76 billion inhabitants, 2.88 billion lived in India and China alone, representing 60.5% of the group‘s total population and 34.8% of the global population. The G19 countries collectively accounted for 57.7% of the world’s population. If the EU (27) and the African Union were included, it would exceed 80%.
Source: Worldometers and World Bank.
In 2024, the GDPs (Gross Domestic Product) of the member countries ranged from US$29.3 trillion (USA) to just US$401 billion (South Africa). The four leading countries alone accounted for 51.1% of global GDP in 2024, while the group as a whole accounted for 78.3%. These figures clearly demonstrate that only a few countries have a decisive impact on the value of production and on global trade. In three articles, the role of the G19 group as a whole and of its individual member countries in the production of the four most important meat types and in the trade of these products will be analyzed. This introductory article addresses the importance of this country group in global meat production.
Parallel increase in global and G19 meat production
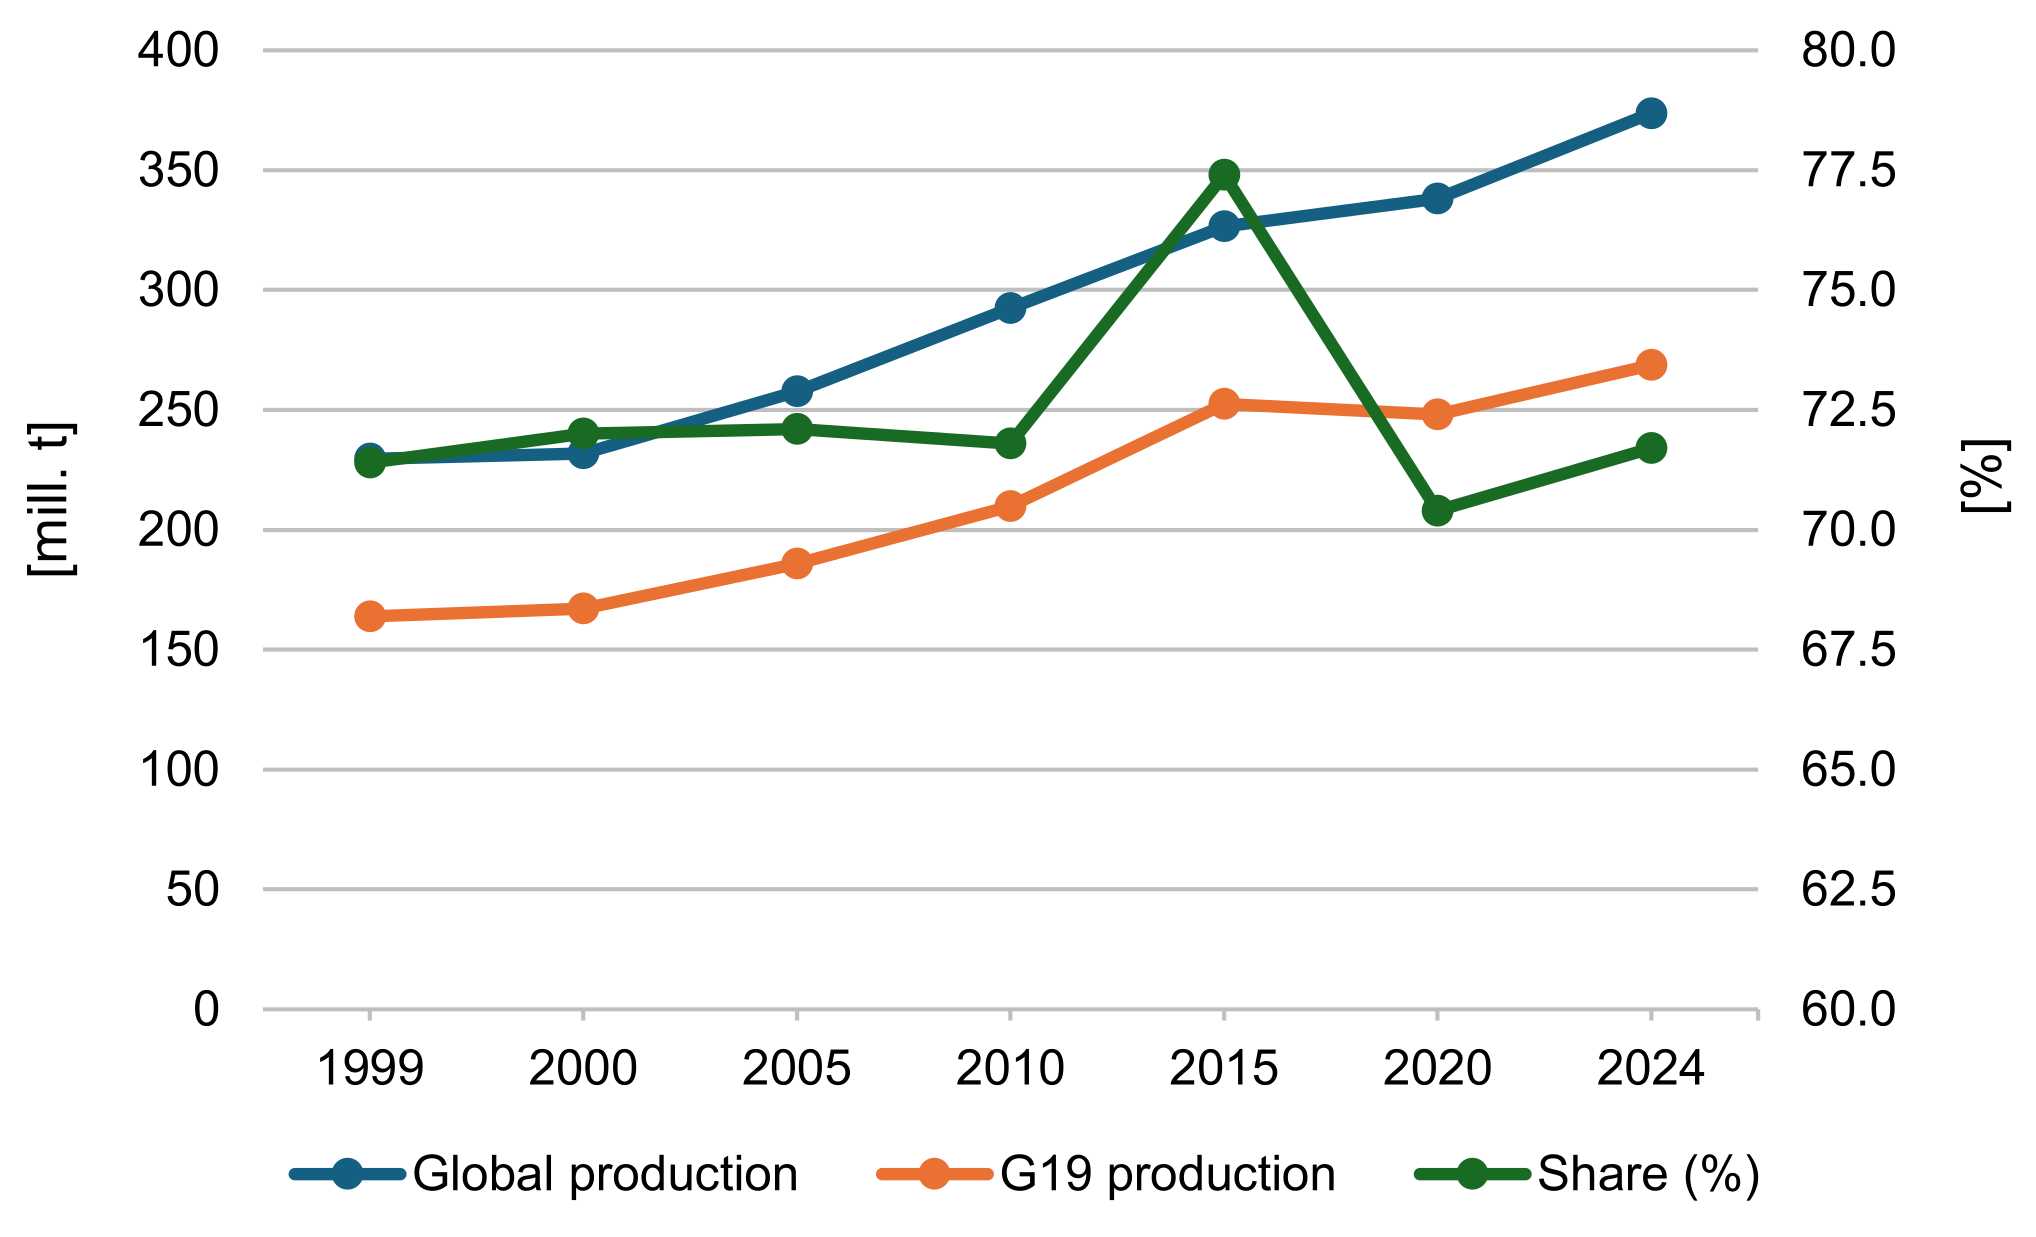
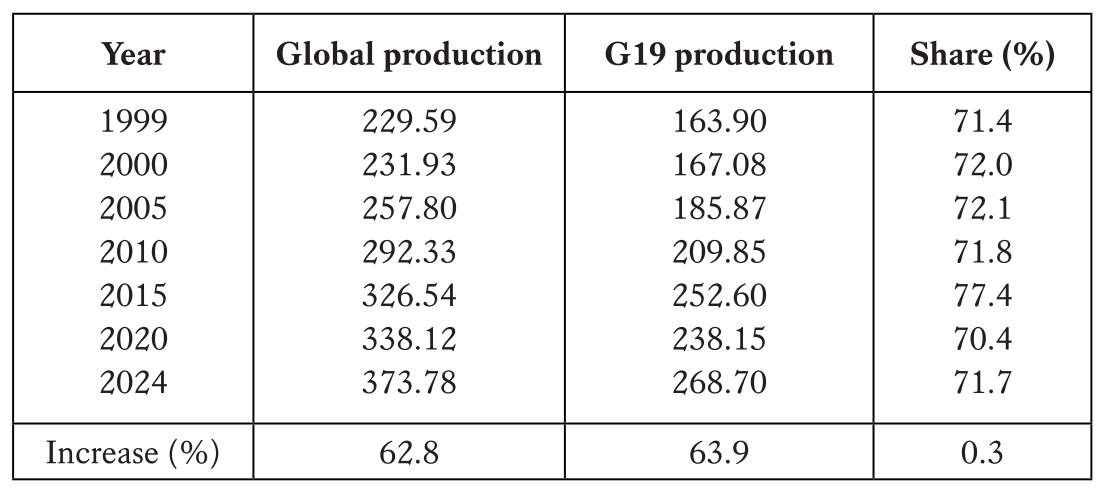
Global meat production increased by 144 million tons, corresponding to 62.8%, between 1999 and 2024. Growth rates slowed down between 2015 and 2020 in consequence of the COVID-19 pandemic and massive outbreaks of the avian influenza virus in North America and Europe, as well as of the African swine fever in Eastern Europe and Asia.
In parallel, meat production of the G19 countries increased by 105 million tons or 63.9%. It is noteworthy, however, that production decreased by approximately 14 million tons between 2015 and 2020, which almost exactly matched the decline in pork production in China. With the successful containment of the African swine fever outbreaks, the production volume rose significantly again, reaching a new peak of 268.70 million tons. The share of the G19 countries in global meat production ranged between 70.4% (2020) and 77.4% (2015) during the period under review, with both years representing exceptional situations (Table 2, Figure 1).
Design: A. S. Kauer based on FAO data.
Source: FAO.
Remarkable shifts in the shares of meat types
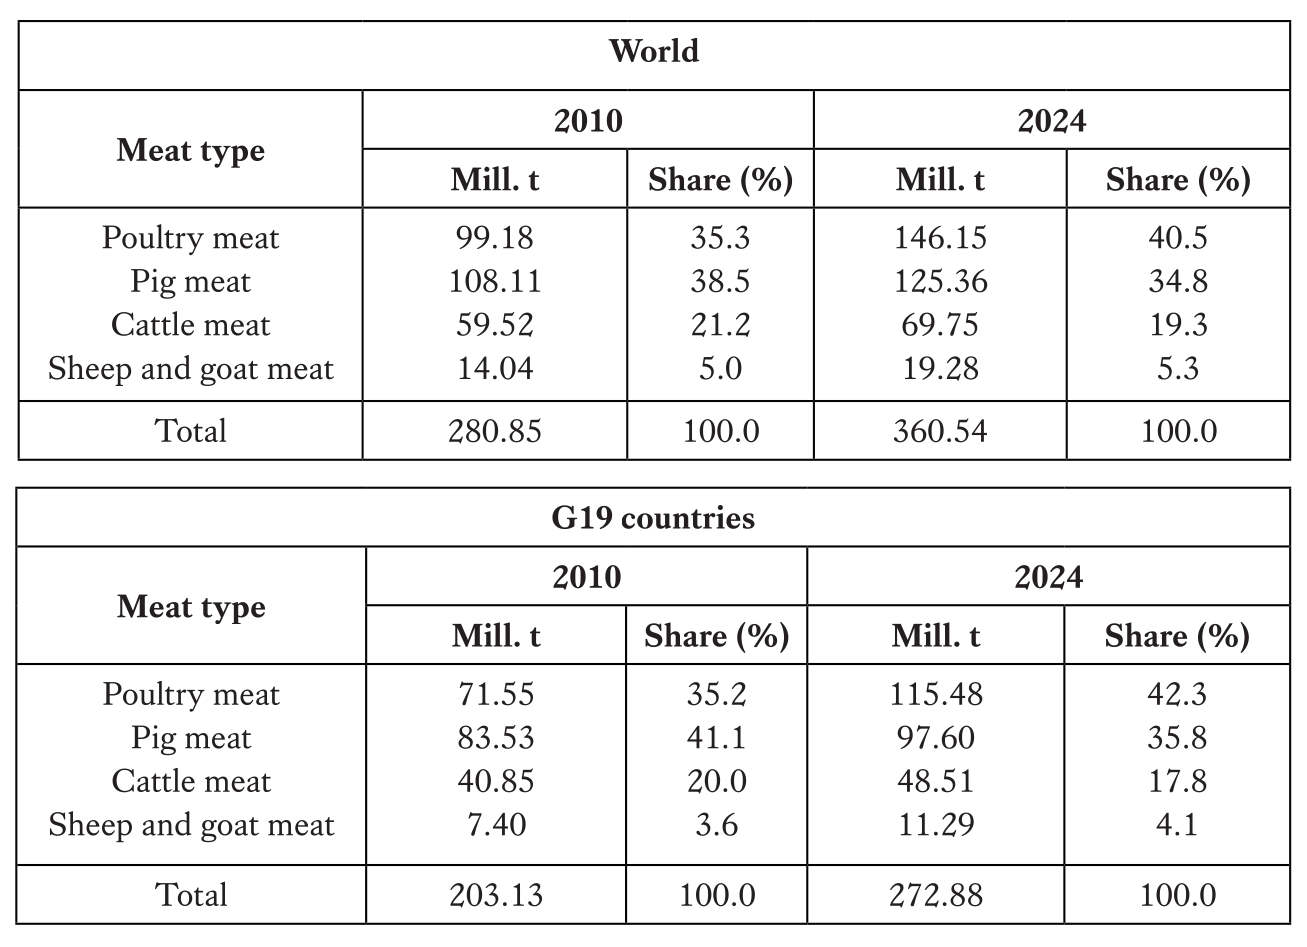
An analysis of the changes in the shares of the four main meat types in global meat production and within the group of the G19 reveals remarkable shifts from red to white meat (Table 3).
Source: own calculations based on FAO data.
Globally, the production volume of the four meat types increased by 80 million tons, or 28.4%. It is worth noting that all four types showed an absolute increase. Poultry meat had the highest growth at 47 million tons, followed by pig meat at 17 million tons. In contrast, cattle meat production rose by only 10 million tons, and sheep and goat meat by 5 million tons. This differing dynamic is reflected in the changes in the shares of the individual meat types in total production. Poultry meat increased its share by 5.2%, and sheep and goat meat by 0.3%. In contrast, pig meat lost 3.7% and cattle meat 1.9%. The trend toward white meat is evident. The author has characterized this as a red-white shift in meat production and consumption (Windhorst 2021, 2025).
A comparison with the development within the G19 group offers some interesting insights. Meat production in this country group increased by 70 million tons, or 34.3%, between 2010 and 2024, thus growing faster than the global average. It is worth noting that of the 80 million tons increase recorded worldwide, 70 million tons, or 87.5%, was attributable to the G19 countries. Poultry meat production increased by almost 44 million tons, representing over 93% of the global growth. The other three meat types also saw significant increases: pig meat by 14 million tons (82.4% of the global increase), cattle meat by 8 million tons (80.0% of the global increase), and sheep and goat meat by 3.9 million tons (78.5% of the global increase). Here too, the differing dynamics resulted in a significant change in the shares of the different meat types in total production. The share of poultry meat increased by 7.1%, and that of sheep and goat meat by 0.5%. In contrast, pig meat and cattle meat declined by 5.3% and 2.2%, respectively.
It can therefore be summarized that the G19 countries accounted for over 70% of global meat production during the period under consideration. The relative increase within this country group was higher than the global average, and there was a clear shift from red to white meat, excluding sheep and goat meat. This reflects both the more efficient feed conversion of poultry species and a change in consumer behaviour. The following section examines which countries were primarily responsible for this shift.
Different developments at country level
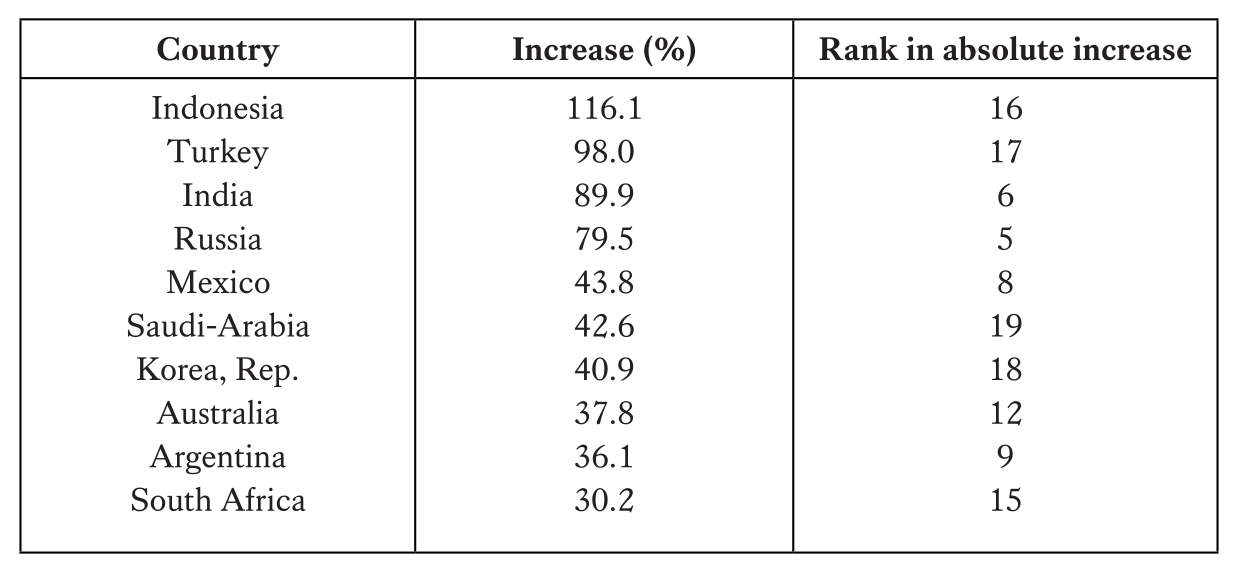
An analysis of meat production trends reveals some remarkable insights. Between 2010 and 2024, meat production, including all meat types, in the G19 countries increased by 52.5 million tons, or 26.6%.
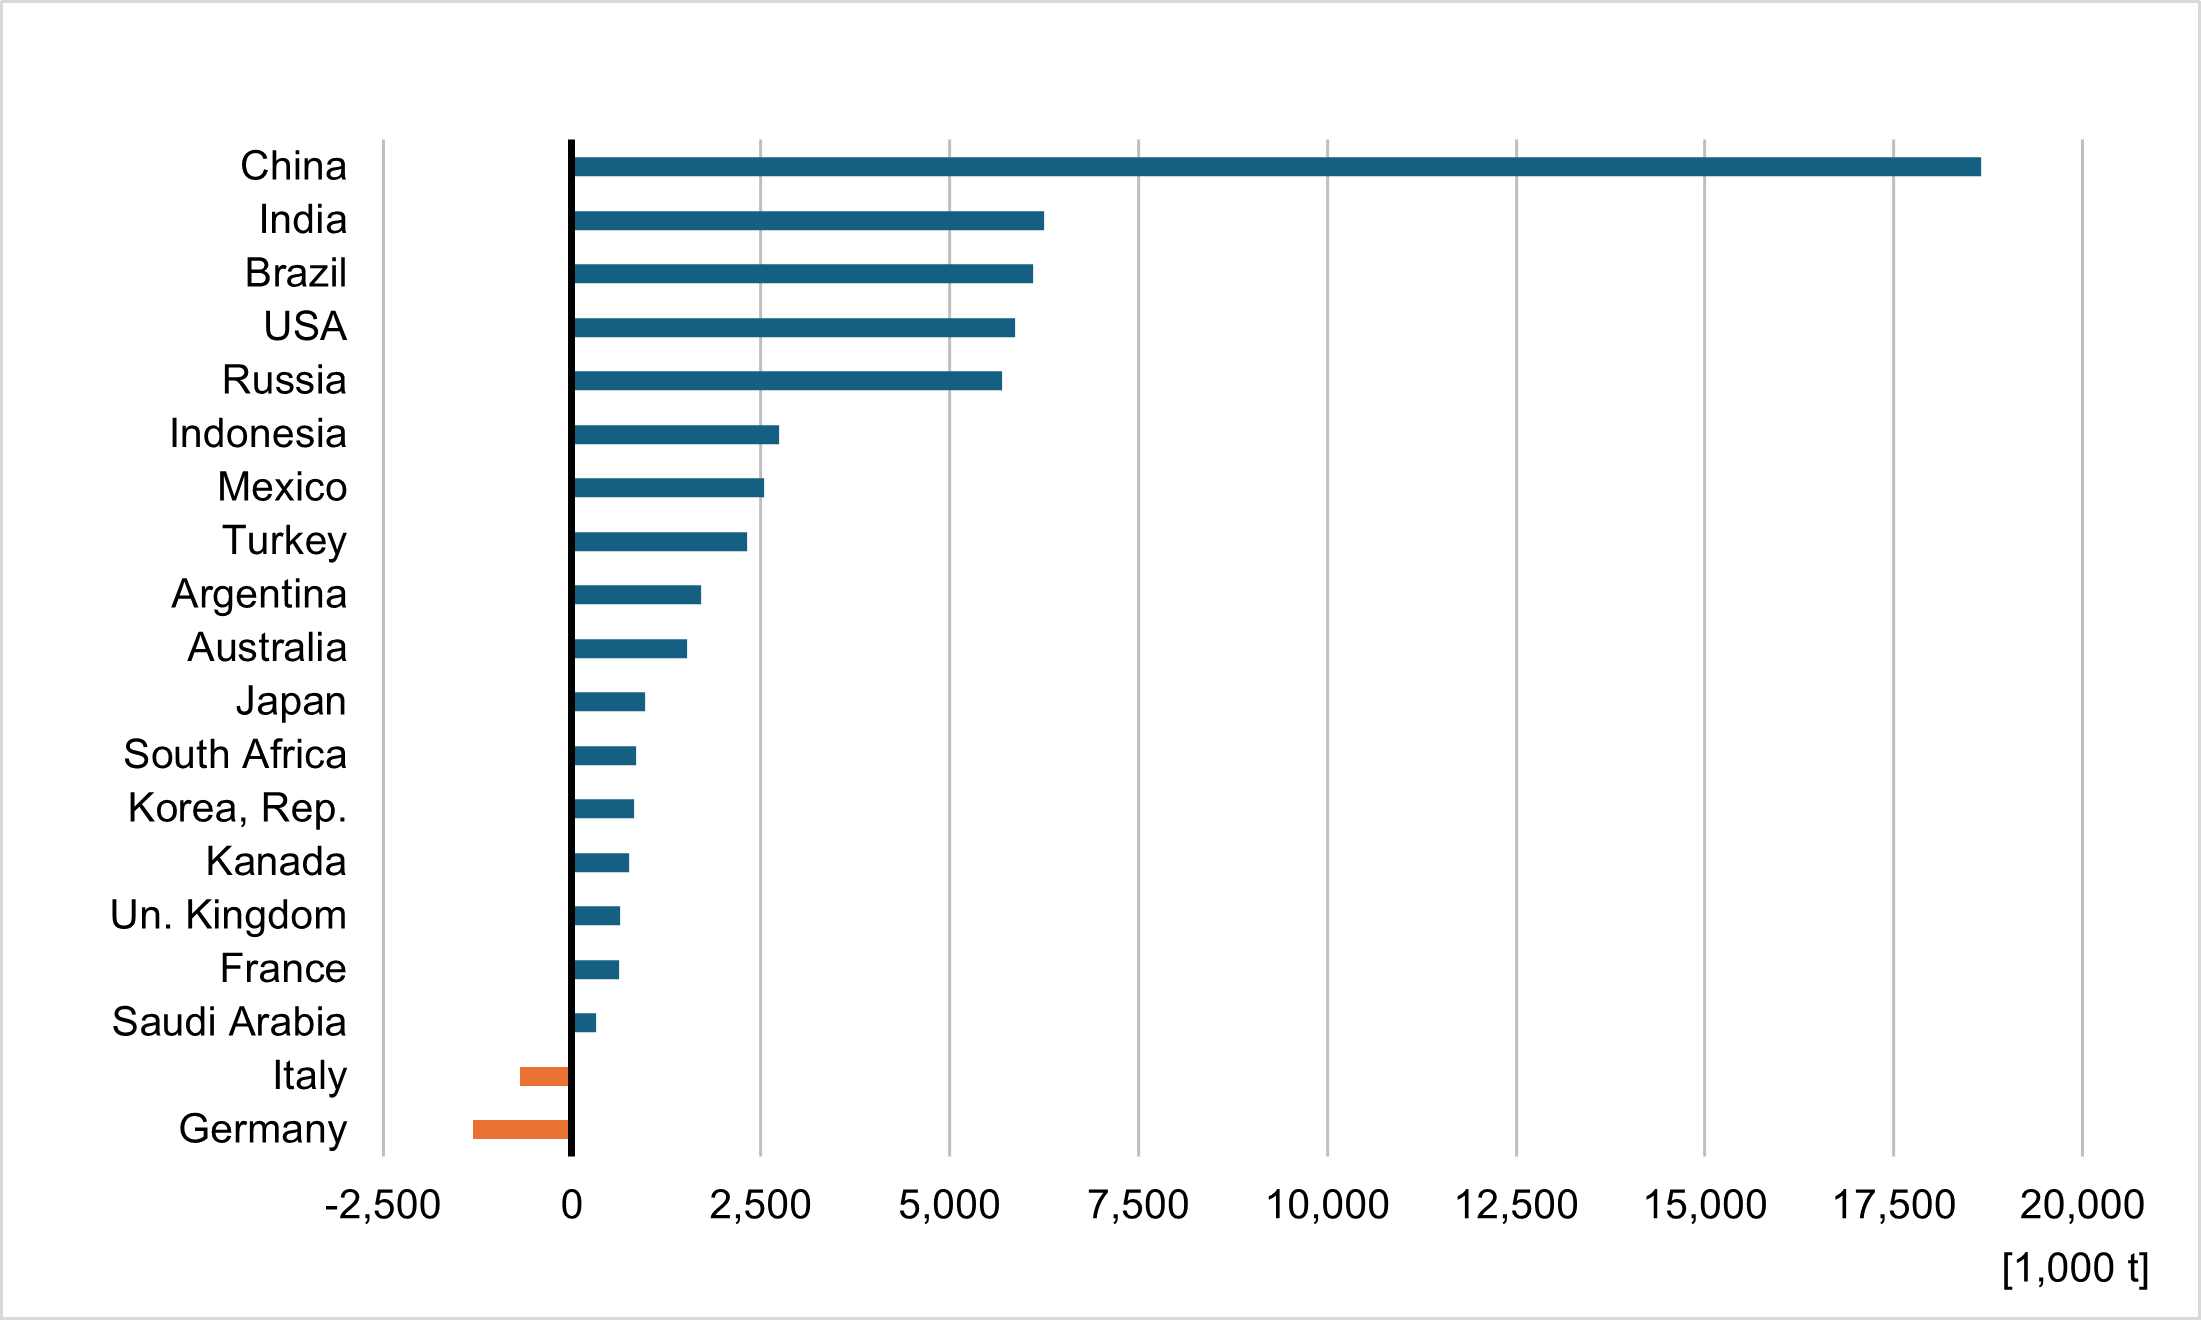
Figure 2 shows that meat production increased in 17 countries, while it decreased in two. China held the undisputed top position with an increase of 18.7 million tons. Four other countries followed with increases between 5.7 million and 6.3 million tons. China alone accounted for 35% of the total growth in the G19 countries, while the five leading countries had a share of 79.8%. Of the four European member countries, only the United Kingdom and France showed a positive growth, while Italy and Germany experienced a decline in production. The specific meat types affected will be explained later in this article. A comparison of the absolute and relative increases in production reveals significant differences (Table 4). Countries that ranked lowest in terms of the absolute increase showed considerably higher growth rates than the leading countries. It is quite obvious that in these emerging countries the demand for meat increased as a result of the economic development and a growing purchasing power among the population.
Design: A. S. Kauer based on the author’s calculations using FAO data.
Source: own calculation based on FAO data.
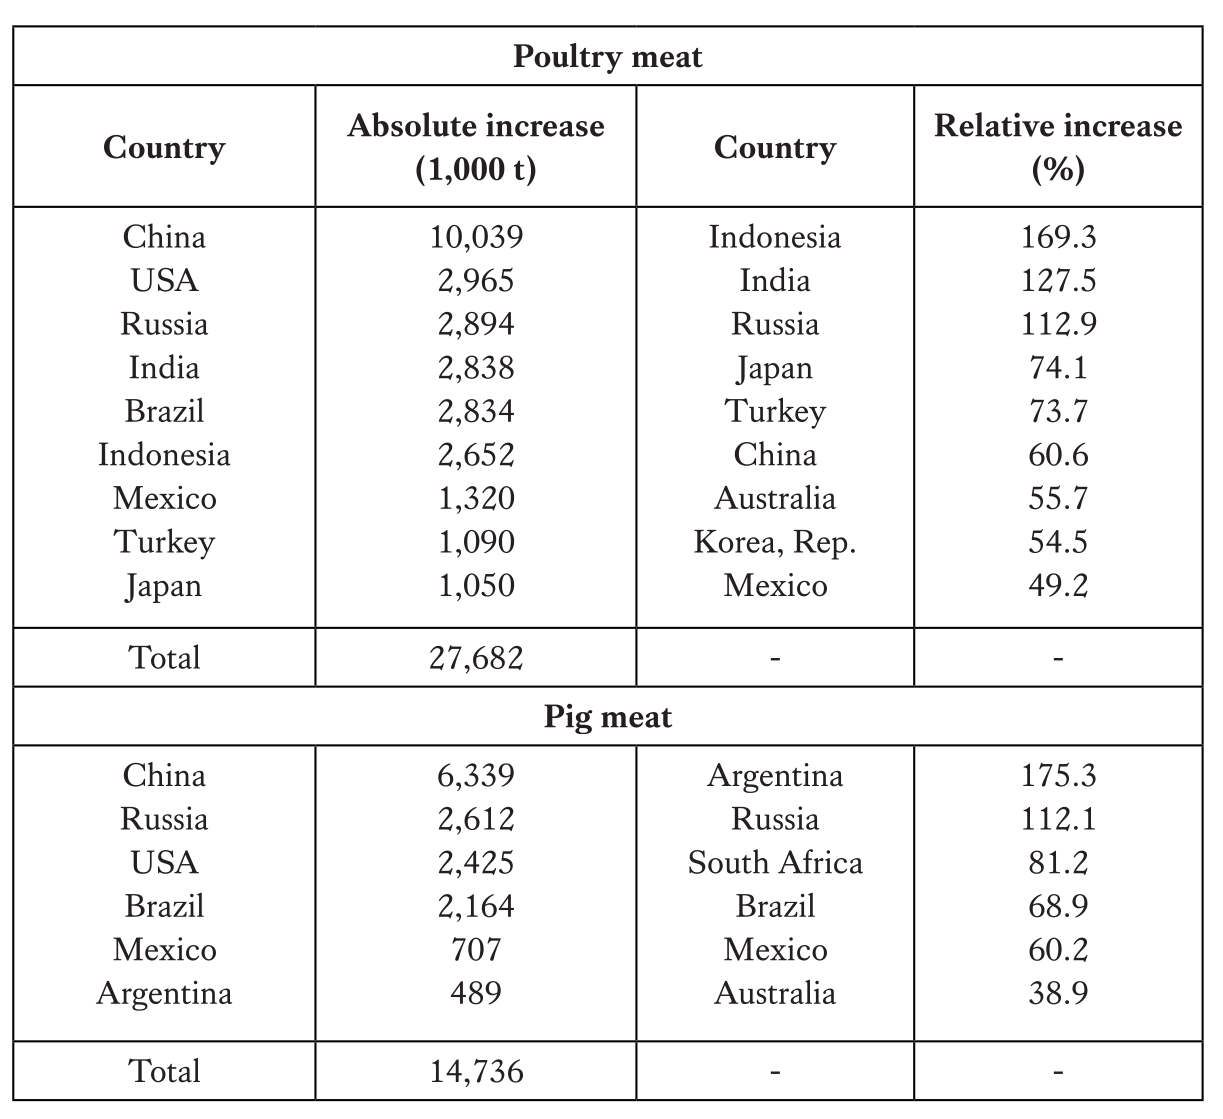
Differing dynamics in poultry and pig meat production
It has already been mentioned that the highest absolute increase in meat production during the period under consideration was observed in poultry and pig meat. Despite some similarities regarding the importance of individual countries, characteristic differences were evident. A closer look at the comparison of the countries in Table 5 reveals that the predominant religion in each country clearly played a role. Because no religious barriers restrict the consumption of poultry meat, all G19 countries showed an increase in both production and consumption. Since pig meat, on the other hand, was either not produced at all or only in very small quantities in both predominantly Islamic and Hindu countries, this type of meat was insignificant in India, Indonesia, and Turkey.
Source: own calculation based on FAO data.
Summary. The dominance of populous countries
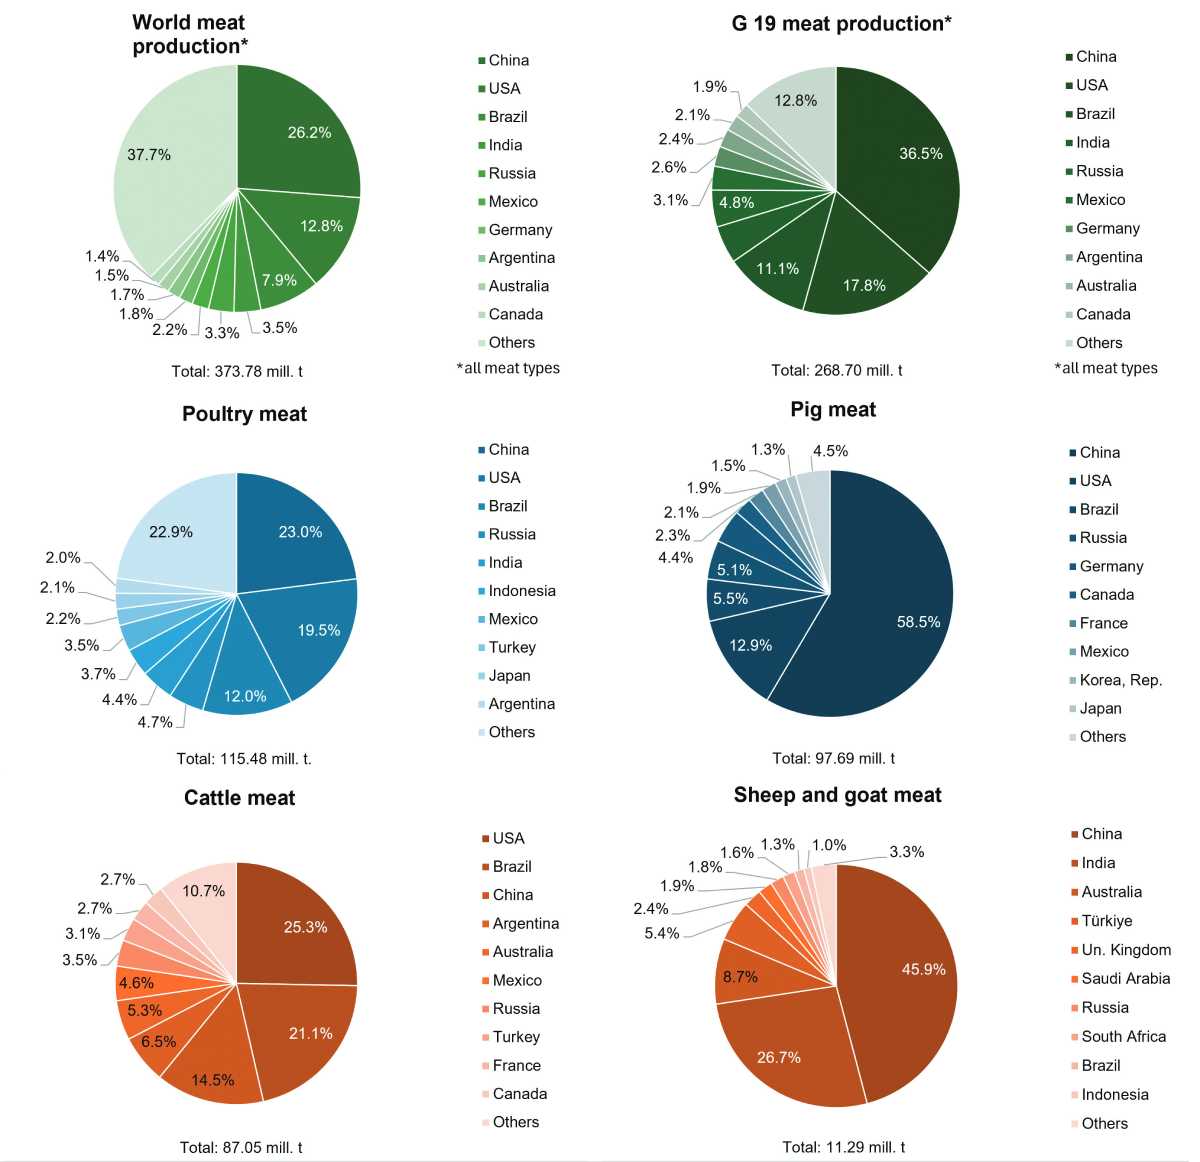
A final analysis of the regional pattern of meat production impressively demonstrates the outstanding importance of the populous G19 countries, not only within the group but also globally (Figure 3).
Design: A. S. Kauer based on author’s calculation using FAO data.
The five leading countries held the top positions both in terms of their share in global meat production and within the group. This also applies to poultry meat, while India was not among the top ten pig meat producers due to the consumption barriers faced by some religious groups. For cattle meat, Argentina and Australia ranked third and fourth, respectively. The decisive factor here was the availability of natural grasslands that allowed for extensive grazing. The United Kingdom’s ranking in fifth place in sheep and goat meat production is surprising at first glance. This reflects the long tradition of sheep farming, which, however, was initially focused on wool production for the textile industry rather than on meat production. The question of whether the dominance of these countries in meat production was also reflected in the meat trade will be analysed in two further articles.
Data sources and supplementary literature
Food and Agriculture Organization of the United Nations. (n.d.). FAOSTAT. https://www.fao.org/faostat/
World Bank. (n.d.). World Bank Open Data. https://data.worldbank.org
Windhorst, H.-W. (2021). Geflügel auf der Überholspur. Die Rot-Weiß-Verschiebung in der globalen Fleischerzeugung (1). Fleischwirtschaft, 101(2), 24–27.
Windhorst, H.-W. (2025). Die Dynamik der Weltfleischerzeugung. Fleischwirtschaft, 105(12), 32–35.
Worldometer. (n.d.). Worldometers. https://www.worldometers.info/

