
Describing and scoring litter moisture and friability can be achieved using consistent terminology as defined in the Litter Guide, which was developed for the Australian chicken meat industry. In this study, we compared the Litter Guide’s litter scores to litter moisture content (%, determined with a standardised oven-drying method). Demonstrating the relationships between litter scores and moisture content (%) may reduce the need to oven-dry litter samples and enable more regular assessment of litter quality, with the added benefit of assessing litter friability.
Introduction
Moisture content and friability are important properties that are commonly used to describe ‘litter conditions’ and ‘litter quality’. They influence how chickens interact with the litter and affect litter thermal properties; microbiome; odour and ammonia production; the weight and volume of spent litter; in-poultry house relative humidity, ventilation and heating requirements; chicken comfort, and risks associated with pathogens, contact dermatitis, foot and joint health.
Researchers measure litter moisture content by drying the litter in an oven until it is completely dry. They then calculate the relative weight of the water compared to the total weight of the litter, reporting this as the percentage moisture content. Poultry growers, on the other hand, do not collect samples of litter from their sheds or determine the oven-dried moisture content. Instead, they assess and describe the litter condition qualitatively based on its appearance, feel, smell and friability.
Meaningful assessment of litter moisture is challenging because conditions vary throughout the shed, at various depths (from the litter surface to the earth/concrete floor) and over time (within each day and over the course of the grow-out). But what measure of litter moisture relates to the risks associated with wet litter? Should the focus be on specific places in the shed, times of the day/batch, how much of the floor is affected and should there be any different approach to assessing friable or caked areas? Is the moisture of small areas of the wettest litter the most important, or is the minimum moisture content of the driest areas? Research papers investigating litter conditions often report the shed-average litter moisture content, for example, 25%, but in reality it would likely have ranged from 15% to 45% at any point in time, and almost certainly changed hour-to-hour and day-to-day. If 25% is regarded as the threshold for wet litter (Collett, 2012), how should growers assess litter moisture and then respond with management actions to minimize potential risks?
Litter friability is another property that is commonly associated with litter quality. It is important because it affects how easily the chickens can ‘work’ the litter (Lister, 2009). Keeping litter ‘working’ is important for breaking up and diluting fresh excreta as well as accelerating litter drying by bringing moist litter to the surface where the water is removed by ventilation. Friability tends to be measured qualitatively (using descriptors) on a spectrum from completely friable to completely caked/capped/crusted. Trying to quantify litter friability (with an absolute measurement) is difficult because it would require quantifying a combination of parameters inducing particle size, aggregation, compaction and cohesiveness.
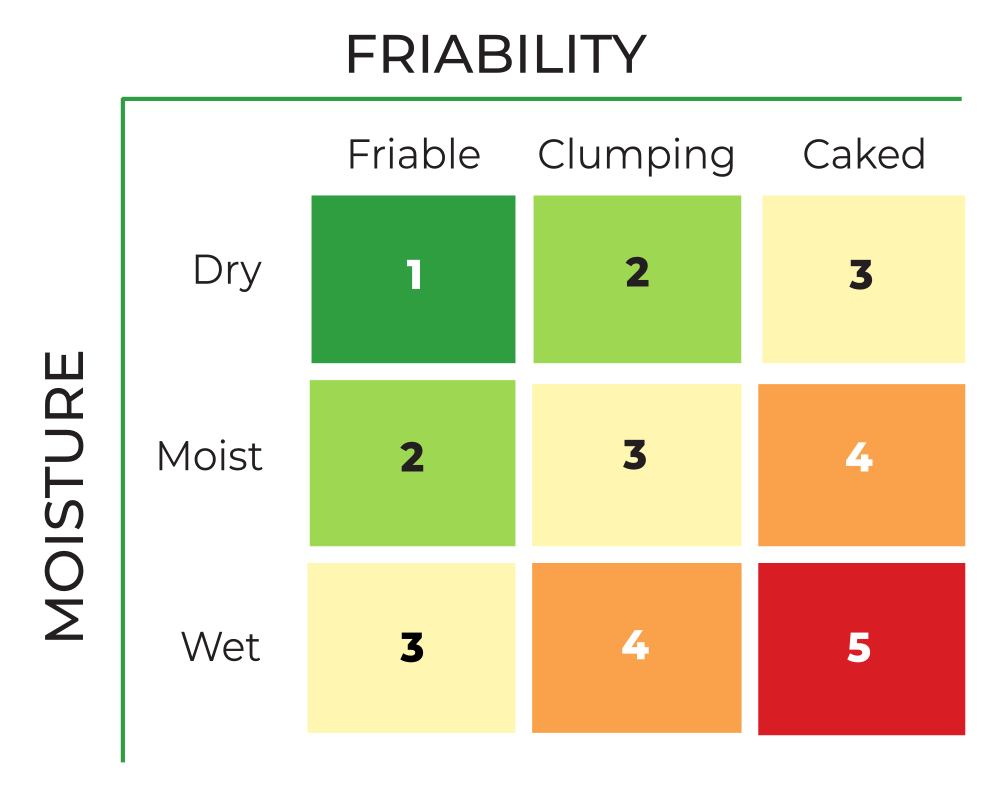
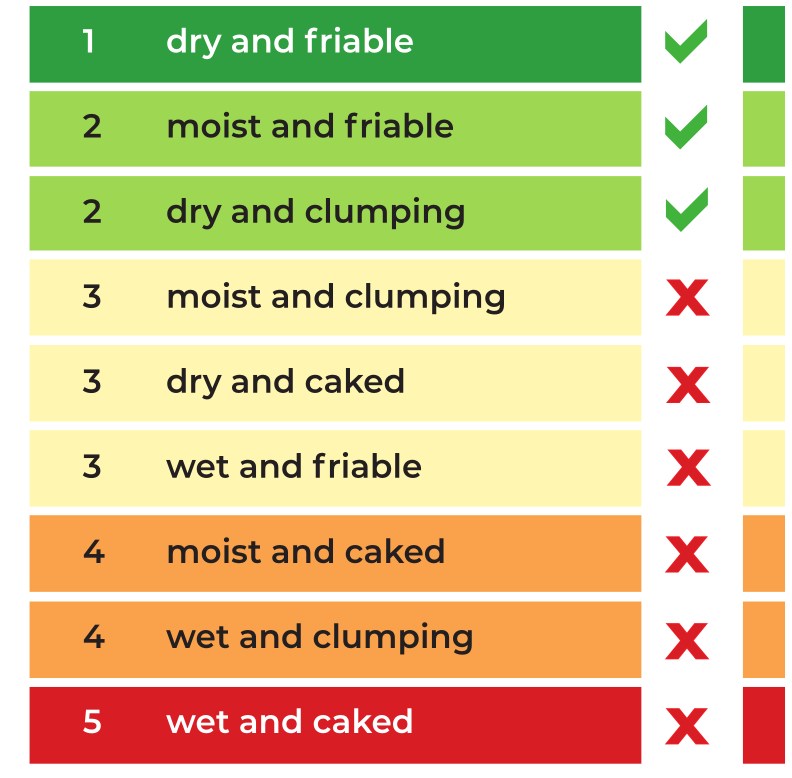
To provide easy-to-use and consistent descriptors of litter moisture and friability, a litter assessment method was developed by a committee of Australian poultry industry representatives and researchers (AgriFutures Australia and DPI Qld, 2020) and is called the Litter Guide. It uses a matrix table (Figure 1) that enables litter to be assessed in terms of moisture (using the descriptive terms ‘dry’, ‘moist’, and ‘wet’) and friability (using the descriptive terms ‘friable’, ‘clumping’, and ‘caked’). The unique combination of each moisture and friability description relates to an ‘overall litter score’ from 1 to 5 (Figure 2) that in a general sense relates to: (a) potential risks associated with the litter condition for the chickens; (b) the urgency required for corrective actions; and (c) the likelihood for the litter condition to deteriorate and require corrective action. The overall litter condition score should not be applied directly as an absolute assessment of risk or trigger for action because the quantity and duration of litter being described by the litter score needs to be factored in, as does any potential risk associated with undertaking corrective actions.
The objective of a recent research study (Dunlop and Pepper, 2023) was to determine relationships between litter condition scores (as described in the Litter Guide) and oven-dried moisture content .
Method
Litter samples were assessed on selected occasions at 22 meat chicken farms with chicken age ranging from 14 d to 51 d. No formal experimental design was used, rather, this was an observational study aimed at assessing the range of litter conditions found in commercial meat chicken farms. More specifically, the focus of this activity was to compare the relationships between quantitative, laboratory-based determination of litter moisture content (%) and qualitative, rapid assessments using moisture and friability scores. Potential variability between the assessment methods because of different farms, in-shed sampling location, bedding material types, chicken age, litter reuse or individual assessors’ scoring were not investigated because commercial application of litter scoring would not be able to adjust based on these and many other affecting factors.
Litter was based on pine or hardwood bedding materials and some had been reused for multiple grow-out cycles. On each occasion, litter samples were collected for moisture content analysis, with litter conditions scored in terms of moisture and friability using the Litter Guide definitions. Litter was assessed before any kind of mechanical disturbance (e.g. litter tilling or catch-out events). Litter was collected from discrete locations or from four sampling transects (two in the front half of the shed and two in the rear). At the transects, multiple small samples were collected from the surface 1–2 cm of the litter along each transect. The surface litter was collected because chickens directly interact with the surface. These samples were then combined to create a representative sample of the respective area within the shed. For each transect, additional samples were collected of visibly dry and visibly damp litter (or from under the drinker lines if there was no visibly damp litter). For each discrete or transect litter sample, moisture content (%) was determined by oven drying the samples to constant weight at 105 °C.
The litter assessment process was performed by two people, with a single score being agreed by consensus for each sampling location. Litter moisture, friability and overall score were compared to the measured moisture content. Data were analysed using Genstat (2022). General linear models were used to assess the differences and relationships between the measured variables, and whether any factors had additional influences. In all models, the different sheds, batch-ages and locations were pooled into the random error term, as there was no interest in compartmentalising these effects.
Results
There were highly significant, positively correlated relationships between each of the litter scores and litter moisture content (%) (P<0.001). Litter moisture scores tended to increase with moisture content (%). Transitions from dry to moist scores occurred at 26–30% moisture content and moist to wet occurred at 38–40% moisture content (referring to the 25th to 75th percentile range displayed by the boxes in Figure 3). Similar differences occurred for the friability scores, with transitions from friable to clumping occurring at 27–28% moisture content and clumping to caked occurring at 38–39% moisture content (Figure 3).
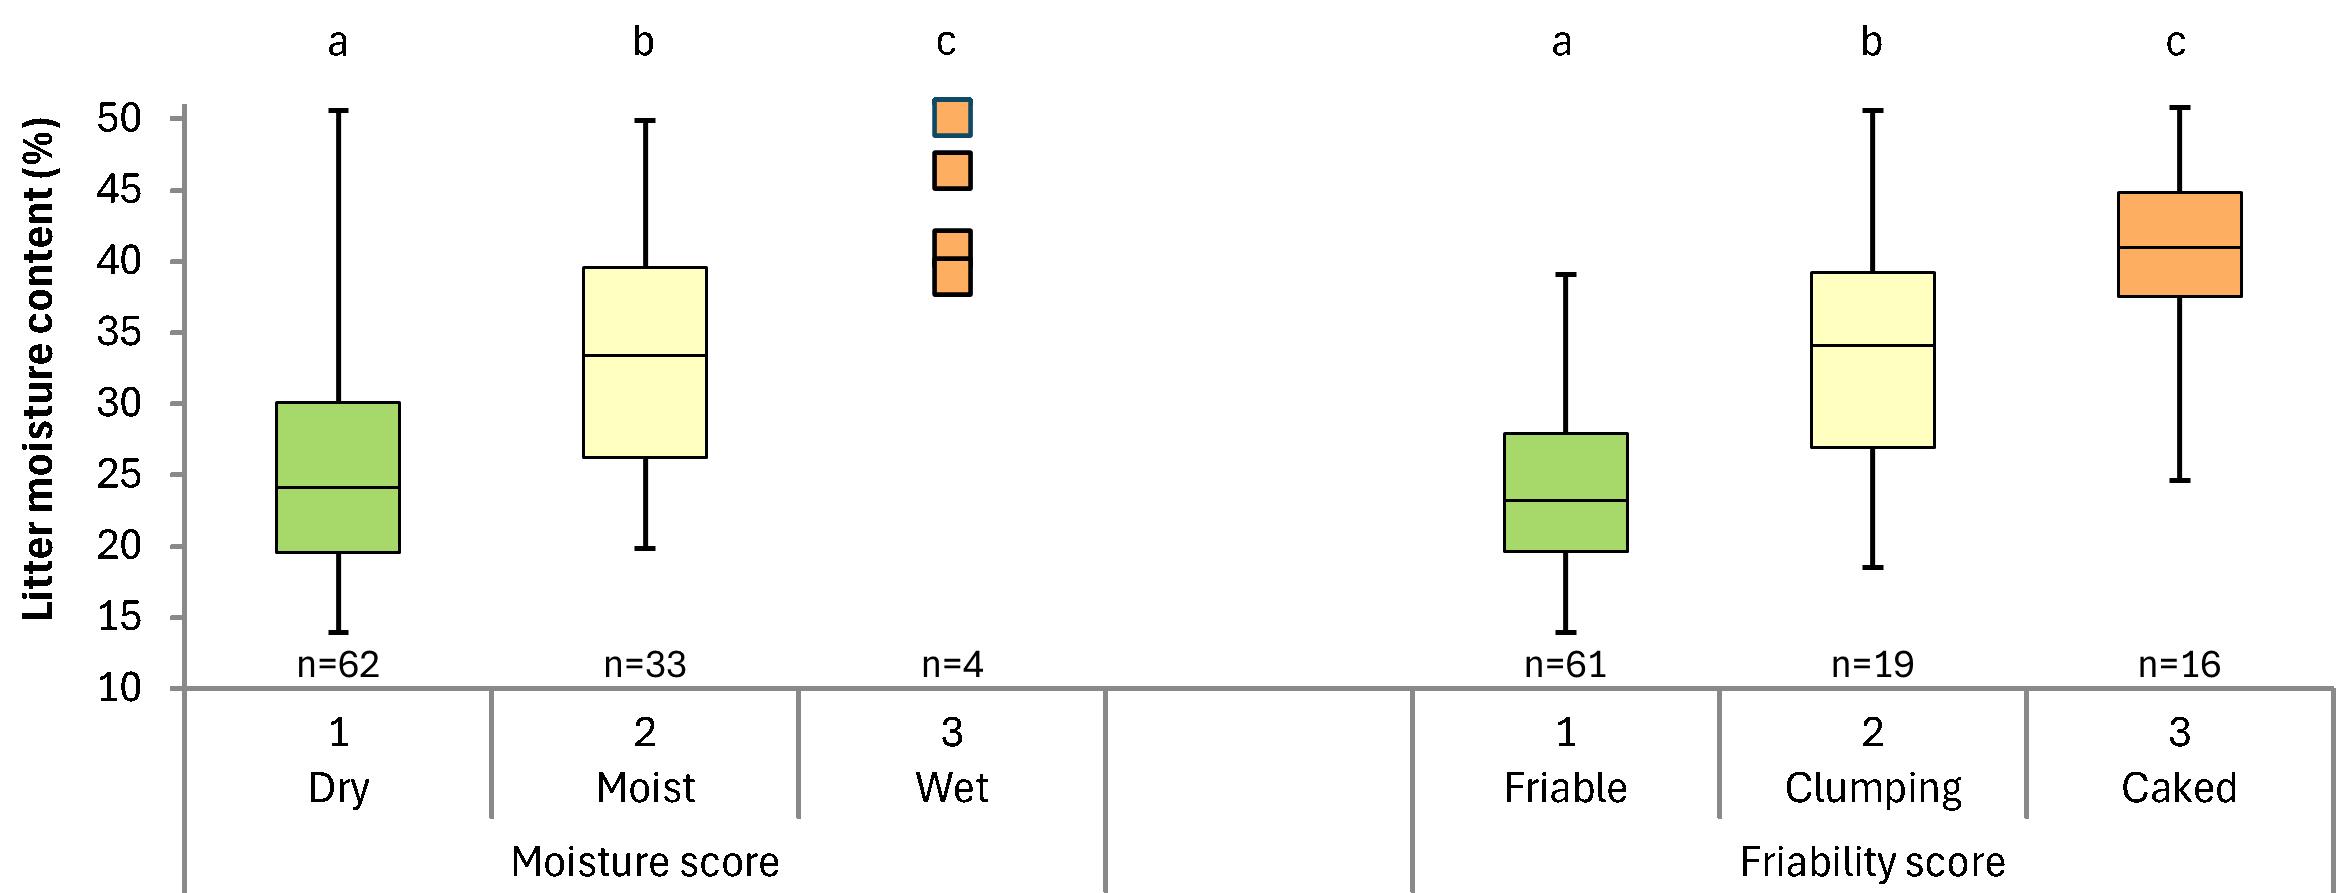
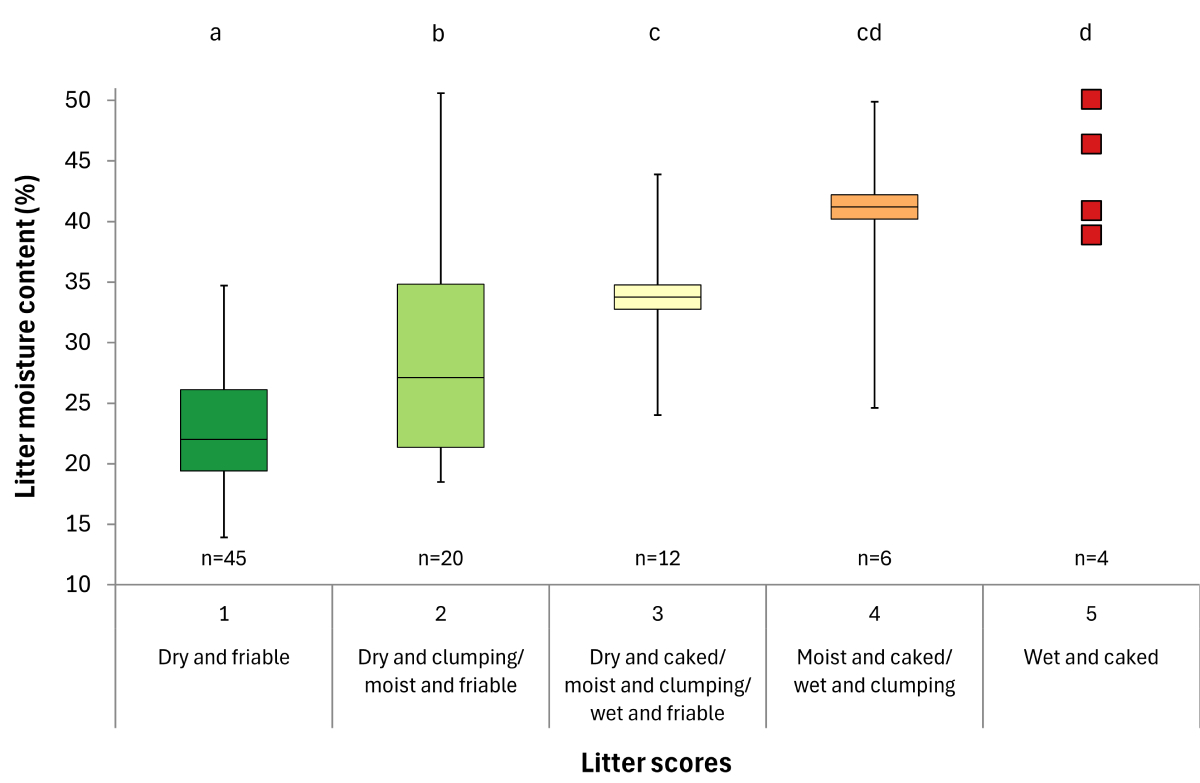
(Boxes represents the 25th to 75th percentile; the line in the middle of the box is the median value and the whiskers represent the maximum and minimum values. Individual data points were shown if there was insufficient data to produce a box with whiskers.)
Litter scores tended to increase with moisture content as they transitioned from dry and friable (score 1) to wet and caked (score 5) (Figure 4). Most litter in this study had a score of 1 or 2, and there were only limited occurrences of scores 3, 4 or 5.
Discussion
The significant, positively correlated relationships between moisture content (%) and the litter scores described in the Litter Guide support the scores to be used to assess litter conditions on commercial farms or research situations. The litter described as dry and friable (score 1), with some occurrences of dry and caked or moist and friable (score 2), is very likely to have moisture content less than 25-35% and therefore considered to be ‘good litter’ (Lister, 2009) and not require urgent corrective actions.
Based on our observations, the low occurrence of litter with scores 3, 4 or 5 was due to growers actively managing litter to keep it dry and friable. Scores 2, 3, and 4 showed wide ranges of moisture content from approximately 18% to 50%, which was not surprising, given that they included multiple litter combinations from dry through to wet and each of the friability scores. For describing the general risks, management requirements and likely persistence of litter conditions, we suggest that the 1 to 5 score is probably sufficient; however, in research settings, there would be benefits to recording the individual moisture and friability scores, or assigning a unique score for each litter combination in the Litter Guide matrix (Figure 1), for example, assigning score 1 to dry and friable up to score 9 for wet and caked. We suggest that in research trials, moisture content (%) should still be the primary measure of litter moisture, but moisture and friability scoring should be used to record additional information about temporal, daily or spatial variability of litter conditions that may be influential in health, welfare, performance or microbial outcomes being measured.
While this study focused on comparing the relationship between litter moisture content (%) and scores for litter moisture, friability and overall condition, future studies should focus on relating litter scores to measurable health, welfare and production outcomes.
© 2025 The State of Queensland acting through the Department of Primary Industries
ACKNOWLEDGEMENTS: We thank the AgriFutures Australia Chicken Meat Program and the Department of Primary Industries, Queensland Government for funding this research (PRJ-011502) and supporting the production of the Litter Guide. We also thank the people who contributed to developing the litter guide and the growers and integrators who contributed to this research.
References
AgriFutures Australia & DAF Qld (2020) Litter Guide, https://chicken-meat-extension-agrifutures.com.au/resource/litter-guide-and-poster/
Collett SR (2012) Animal Feed Science and Technology, 173: 65-75
Dunlop M & Pepper C-M (2023) Litter management to support chicken meat production and industry growth. https://agrifutures.com.au/product/litter-management-to-support-chicken-meat-production-and-industry-growth/
Lister SA (2009) Proceedings of 17th European Symposium on Poultry Nutrition, Edinburgh, Scotland. (WPSA), http://www.cabi.org/Uploads/animal-science/worlds-poultry-science-association/WPSA-scotland-2009/5_lister_nutrition2009.pdf


