
The second, and the last paper, in a series of two which deals with the egg industry in the Group of Nineteen countries between 2006 and 2016. This article will analyze dynamics and patterns of egg exports, imports, the development of the egg trade balances and the perspectives of the global market.
The G20 (Group of Twenty) was founded in 1999 in Berlin as a forum of 19 individual member countries and the EU[1]. It substituted the former G8 group. The main goal of the forum is to undertake means which contributes to the stability of the global financial situation. The heads of the G20 countries hold annual summits to discuss financial and trade matters. Conferences of the finance and foreign ministers hold separate meetings. The composition of the group has been criticized frequently in the past. In this report, 19 instead of 20 countries are analysed. The EU is omitted as four member countries are among the G19 and the author in 2017 already published a detailed study titled “The EU Egg Industry in Transition” for the IEC.
Dynamics and patterns of egg exports by the G19 countries
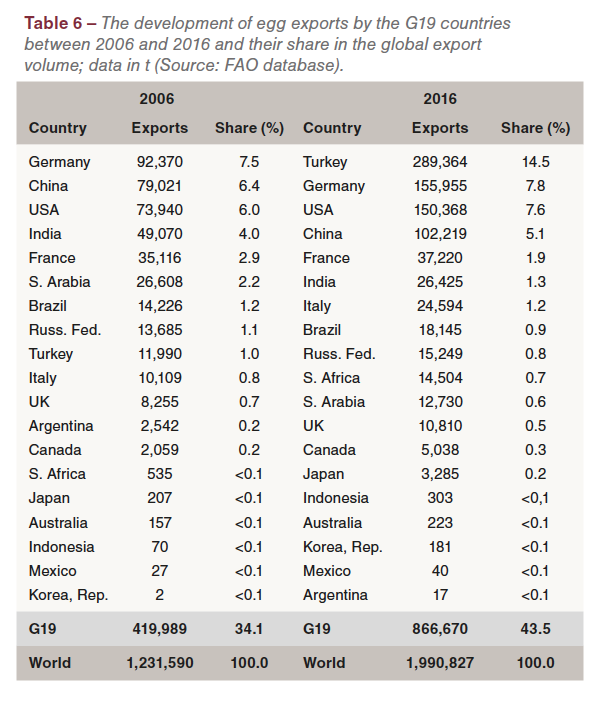 Global egg exports grew by about 759,000 t or 61.6%; exports by the G19 countries increased by almost 447,000 t or 106.4% (Table 6). Their share in the absolute global growth was 58.9%. Obviously, several G19 countries were not only able to intensify their production but also generate a surplus which they could export.
A closer analysis of the changes in the ranking and the export volumes reveals some remarkable dynamics. Turkey became the leading exporting country and shared 14.5% of the global export volume in 2016, second behind the Netherlands with 17.6%. Germany replaced China in second place, India lost two ranks. While India lost 2.7% of its former share in global egg exports and China 1.3%, Turkey gained 13.5%, USA 1.6% and Germany 0.3%. It is surprising at first glance that Germany with a self-sufficiency of only 67% in 2016 exported almost 156,000 t of shell eggs. This is due to the fact that several Dutch farmers own egg farms in Eastern Germany from which they ship them to the Netherlands. There they are either exported or further processed. These eggs are counted as German exports.
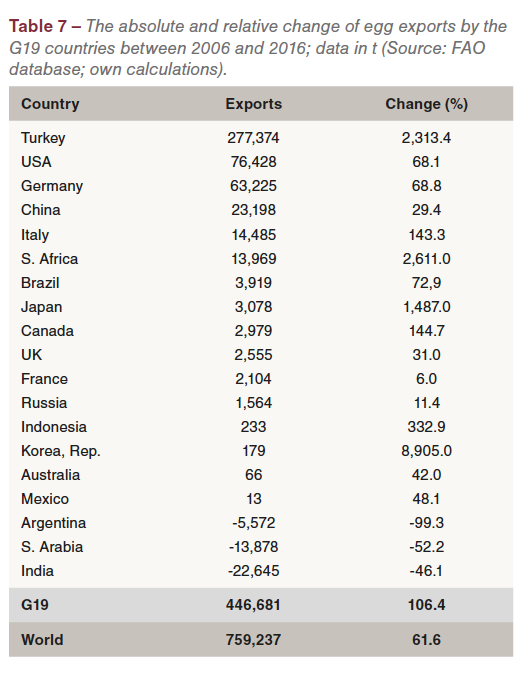 In Table 7, the G19 countries are listed according to the absolute change of their egg exports. China, the USA and Germany ranked in the first three positions. Together, their volume grew by 417,000 t, a share of over 93% in the total increase of the G19 countries. Argentina, Saudi Arabia and India reduced their exports considerably. Saudi Arabia and India exported less eggs because of the fast increase of the per capita consumption and a rising domestic demand. The data for Argentina differ, depending on the data source. While FAO reported an export volume of only 17 t in 2016, the IEC Annual Review reported 8,346 t. As there is no data for 2015 in the IEC statistics, the relative change cannot be calculated on this data base.
The relative changes fluctuated between over 8,900% for Korea and 6% for France. The growth rate of 2,313% for Turkey reflects the rapid growth of egg production and the high surplus over demand.
Dynamics and patterns of egg imports by the G19 countries
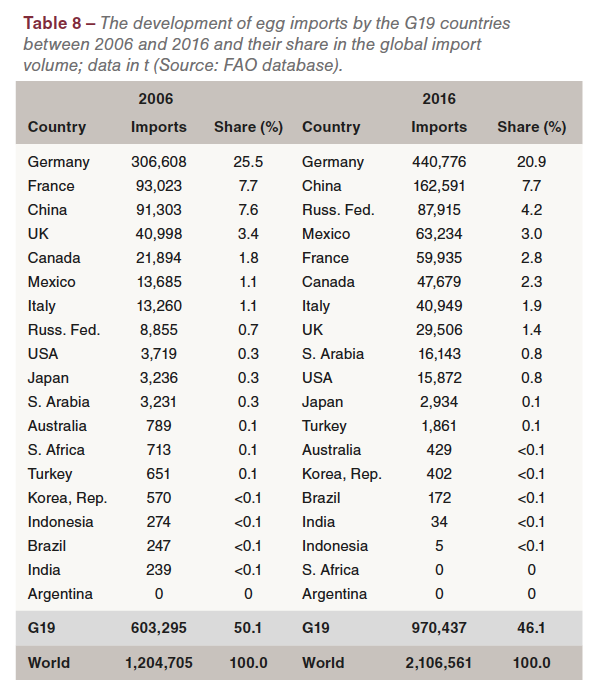 In contrast to exports, egg imports of the G19 countries grew slower than global imports. The global imports increased by almost 902,000 t in the analysed decade and reached a volume of 2.1 mill. t in 2016, which equals a relative growth of 67.4%. The imports of the G19 countries only increased by 367,100 t or 60.9%. To the global increase the G19 countries contributed 40.7% (Table 8).
A comparison of the ranking of the G19 countries in 2006 and 2016 shows some interesting changes. While Germany remained in the top position, despite losing 4.6% of its former share, China stepped up one rank, the Russian Federation jumped from rank 8 in 2006 to rank 3 in 2016. Mexico and Saudi Arabia also climbed upward in the ranking while France and the United Kingdom fell to lower ranks. In 2016, seven of the G19 countries shared either less than 0.1% of the global import volume or did not import shell eggs.
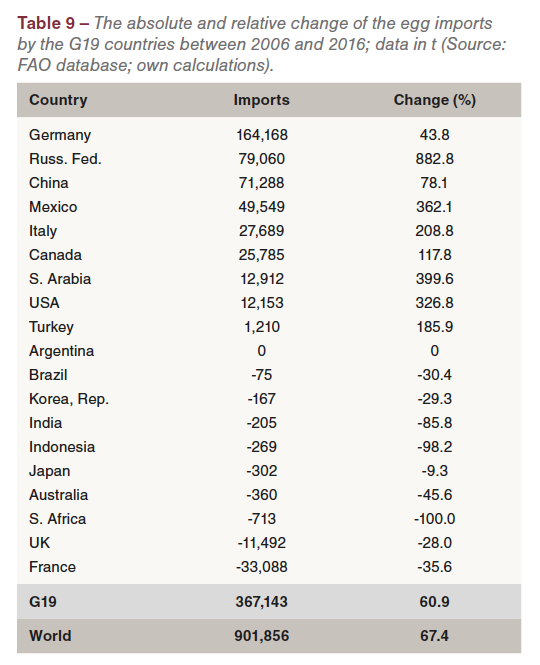 In Table 9, the G19 countries are listed according to their absolute change in egg imports. Nine countries imported more eggs in 2016 than in 2006; nine countries reduced their imports in the analysed time period. Only Argentina did not import eggs in 2006 and 2016 and South Africa stopped imports in 2006. The highest import increase showed Germany, followed by the Russian Federation, China and Mexico. In Germany, the per capita consumption increased from 209 eggs in 2006 to 235 eggs in 2016. The fast growth could not be met by the domestic production so that higher imports became necessary. The same is true for the Russian Federation where the per capita consumption grew by 50 eggs in the analysed decade. The higher imports in Mexico were a result of several AI outbreaks and a considerable egg shortage. The import increase of Saudi Arabia was also a result of a fast growing domestic demand. The USA was forced to import eggs as a result of the Avian Influenza outbreaks in 2015 to fulfill delivery contracts with the food industry.
Only in two of the nine countries with decreasing imports, the reduction reached considerable amounts, the United Kingdom and France. In the United Kingdom, the growing production and a more or less stagnant per capita consumption made it possible to reduce the imports. In France, egg production increased by 18.9% between 2006 and 2016 and the per capita consumption fell from 225 to 219 eggs. A sharp reduction of the imports was the result of this reverse development.
Dynamics in the development of the egg trade balances in G19 countries
 In a final step, the dynamics in the development of the egg trade balances in the G19 countries between 2006 and 2016 will be analysed.
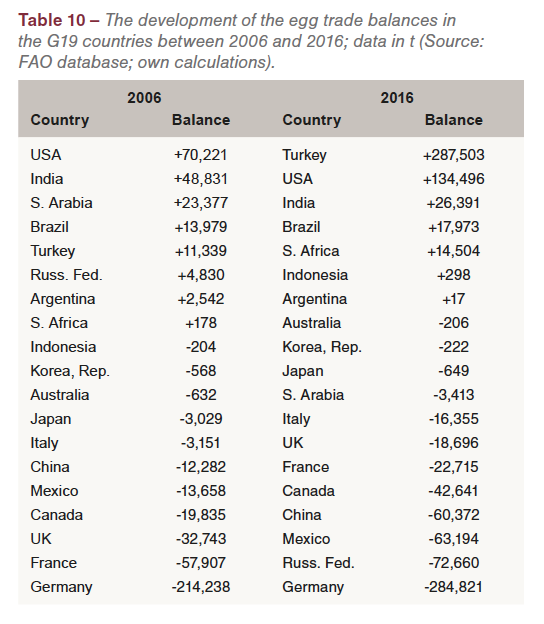
A comparison of the rankings in 2006 and 2016 reveals considerable changes. In 2006, the USA had the highest trade surplus, followed by India, Saudi Arabia, Brazil and Turkey. Ten years later, Turkey ranked in first place with a surplus of 287,503 t, more than twice as high as that of the USA. India’s surplus decreased by 22,000 t, Saudi Arabia even had a negative trade balance in 2016. The highest trade deficit in 2006 showed Germany, France, the United Kingdom, Canada and Mexico. Ten years later, Germany’s deficit had further increased by over 70,000 t. The Russian Federation had a surplus in 2006, but the second highest negative balance in 2016. Mexico’s negative trade balance became higher because of the Avian Influenza outbreaks.
The data in Table 10 document that the regional concentration was very high in positive as well as in negative trade balances. A few countries either had a considerable surplus over demand and also only a few countries had remarkably high deficits in their trade with shell eggs.
Summary and perspectives
The preceding analysis could show that in 2016 the share of the G19 countries in the global population and the laying hen inventory was quite balanced with 64% respectively 63%. Their share in global egg production was much higher with 76%. This indicates that in most of the G19 countries egg production was very efficient regarding breeding, feeding, veterinary surveillance and housing. In contrast, the share of the G19 countries in global egg trade was much lower with 44% in exports and 46% in imports.
This reflects the ability of most G19 countries to meet the growing demand by intensifying their domestic egg production. Nevertheless, the trade balance with eggs for the single countries differed considerably between a high surplus and the necessity to import large amounts of eggs to meet the growing demand.
It can be expected that the share of the G19 countries in global egg production will further increase because of the remarkable dynamics in several countries, such as India, Indonesia, Brazil and Turkey. The fast growing demand in parts in Western Asia and India may result in higher imports. On the other hand, the progress which several countries of the G19 group have made over the past decade in efficient production systems may enable them to raise their export volumes.
Data sources, references and suggestions for further reading
G20: https://en.wikipedia.org/wiki/G20.
Windhorst, H.-W.: The extraordinary dynamics of the Turkish poultry industry. In: Zootecnica International 37 (2015), no. 9, p. 26-30.
Windhorst, H.-W.: A projection of the future dynamics in global egg production. In: Zootecnica International 40 (2018), no. 7/8, p. 24-26.
Windhorst, H.-W.: China, India, Japan – the three leading countries in Asia’s egg industry. London: International Egg Commission 2018.
Windhorst, H.-W.: Mexico’s egg industry. In: Zootecnica International 40 (2018), no. 3, p. 34-37.
FAO database: http://www.fao.org/faostat
Worldbank: https://data.worldbank.org/
[1] Member countries are: Argentina, Australia, Brazil, Canada, China, France, Germany, India, Indonesia, Italy, Japan, the Republic of Korea, Mexico, the Russian Federation, Saudi Arabia, South Africa, Turkey, the United Kingdom, the United States and the European Union.


