
Between 1996 and 2016, the value of U. S. egg production increased by 36.3% and reached a volume of 6.5 billion US-$. In this paper the dynamics of the egg industry and of egg trade will be analysed.
Remarkable increase of the value of poultry production
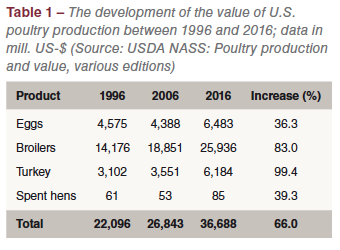 The value of U. S. poultry production increased from 22.1 billion US-$ in 1996 to 36.7 billion US-$ in 2016. To the growth of 14.6 billion US-$, broiler production contributed 70.7%, egg production 17.7% and turkey production 16.9% (Table 1). A comparison of the relative growth rates shows that value of broiler and turkey meat production grew much faster than that of egg production. This is mainly due to the fact that egg prices remained fairly stable while those of broiler and turkey meat increased considerably over the past two decades.
Considerable dynamics in laying hen inventors and egg production
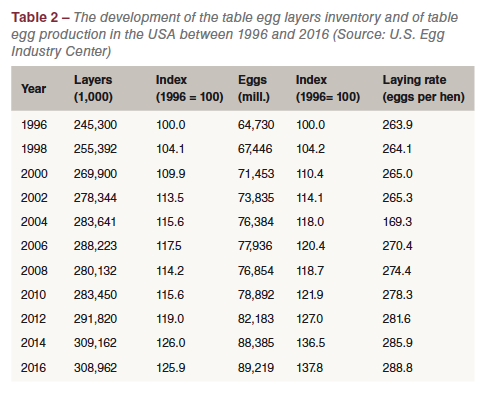 In Table 2, the development of the number of table egg layers and of egg production between 1996 and 2016 is documented. Egg production grew faster than the number of laying hens because of the considerable increase of the laying rate by almost 25 eggs per hen and year in the analysed time period. Of the table egg layers about 13.6 mill. hens produced hatching eggs. They were concentrated in the leading states of broiler production in the Southeast.
Table 3 shows the development of the U. S. table egg layer flocks in farms with more than 30,000 hens in the ten leading states between 1996 and 2016. Farms of this size 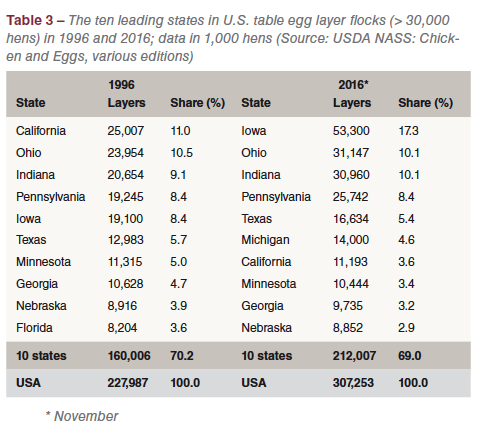 contributed 96.4% to the total number of table egg layers in 2016. A closer look at the ranking and the share of the states reveals some interesting changes.
In 1996, California ranked in first place with a share of 11.0%, followed by Ohio and Indiana. In 2016, Iowa ranked as number one with a contribution of 17.3% to the total number of table egg layers. Within only two decades, the inventory had increased from 19.1 mill. hens to 53.3 mill. hens or by 279.1%. California lost 13.8 mill. laying hens in these two decades and ranked only in seventh place in 2016. The main steering factors behind the dramatic decrease of the laying hen inventory were the high production costs and the impacts of Proposition 2 which prohibits keeping laying hens in conventional cages from 2015 on.
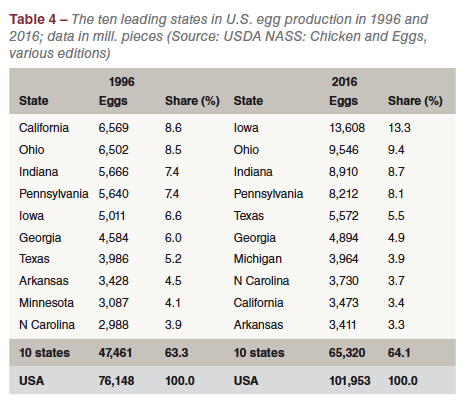 In Table 4, the development of total egg production in the USA between 1996 and 2016 is documented at state level. Because of disclosed data for some of the leading table egg producing states, the volume of table eggs by states cannot be presented. The considerable number of produced hatching eggs in some states results in a ranking which not reflects the situation in table egg production. Georgia for example would not show up in a list of the leading table egg producing states. Nevertheless, the table gives a good impression of the changes in the spatial pattern of egg production between 1996 and 2016. In 1996, California also ranked in first place in egg production with a share of 8.6% in total U. S. egg production, followed by Ohio, Indiana and Pennsylvania. Twenty years later, Iowa was the leading state in egg production, sharing 13.3% of the overall production volume; California fell back to ninth place (Table 4). Figure 1 shows the spatial pattern of total egg production in the USA in 2016.
Egg exports less important than poultry meat exports
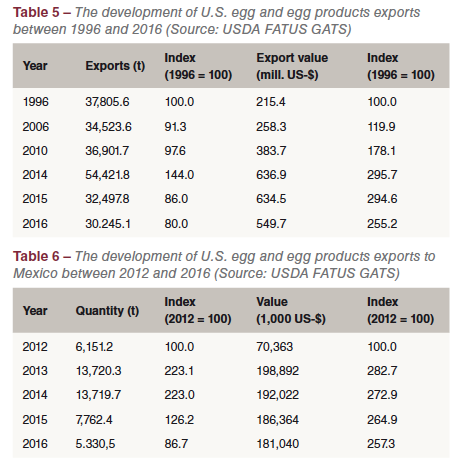 In contrast to broiler and turkey meat, exports of shell eggs and egg products are less important for the U.S. poultry industry. Only 30,245 t of eggs and egg products valued 549.7 mill. US-$ were exported in 2016. Broiler meat, in contrast, reached an export volume of more than 3 mill. t valued 2.9 billion US-$. Table 5 shows the development of the exports of eggs and egg products between 1996 and 2016. With the exception of 2014, the export volume reached values between 30,000 t to 38,000 t. In 2014, the export volume increased considerably and the export value more than doubled compared to 2010.
Because of the disastrous impacts of the AI outbreaks in 2013 and 2014, Mexico was forced to import large amount of eggs and egg products to meet the domestic demand (see Windhorst, 2018). Between 2012 and 2013, U. S. exports to Mexico more than doubled (Table 6), and it was not before 2016 that the exports reached volumes similar to those before the AI crisis. Because of the shortage in the USA as a result of the AI outbreaks in the Midwest in 2015, the value of egg and egg products exports remained on a high level even until 2016.
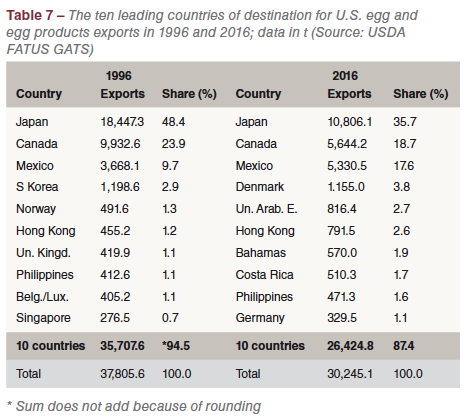 A more detailed analysis of the trade relations reveals that with the exception of Japan, Canada and Mexico, the countries of destination fluctuated considerably (Table 7). The three leading countries shared between 70% and 80% of the export volume. While the share of Japan and Canada decreased considerably between 1996 and 2016 that of Mexico increased. The other countries of destination were located in the EU, Central America and East Asia. Even though it is not possible to differentiate between shell eggs and egg products, it can be assumed that egg powder was the main exported product, with the exception of Mexico. The lower export volume in 2016 was a result of the AI outbreaks in 2015 which mainly affected the egg products industry in the Midwest of the USA. In the late 1990s, imports of eggs and egg products were only of minor importance. Canada was the leading country of origin. In the following decades, the import volume and
 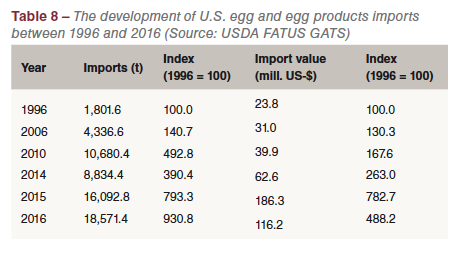 the value of imports grew considerably (Table 8). Besides Canada, EU member countries gained in importance. In 2016, the Netherlands ranked in second place with a share of 25.5%. The shortage of eggs forced the egg processing industry in the USA to import shell eggs for further processing and egg powder. The main results of the preceding analysis can be summarized as follows:
- Between 1996 and 2016, the number of table egg layers grew by 25.9% and that of table egg production by 37.8%.
- Parallel to the growth of egg production, a spatial shift changed the spatial pattern of the egg industry considerably. While in 1996 California was the leading egg producing state, Iowa has been ranking in first place since 2001, followed by Ohio and Indiana. California only ranked in ninth place in 2016 after having lost about 47 % of its former production volume.
- S. trade with eggs and egg products is much less important than trade with poultry meat, especially broiler meat.
References
USDA, NASS: Chicken and Eggs. Washington, D. C. Various editions.
U.S. trade statistics: https://www.nass.usda.gov/Surveys/Guide_to_NASS_Surveys/Chickens_and_Eggs/index.php.
USDA NASS: Poultry production and value. Washington, D.C. Various editions.
http://usda.mannlib.cornell.edu/usda/current/PoulProdVa/PoulProdVa-04-28-2017.pdf.
USDA, Trade Statistics: https://apps.fas.usda.gov/gats.
Windhorst, H.-W.: Avian Influenza outbreaks in Iowa layer farms and their economic impacts. In: Zootecnica international 37 (2015), no. 12, p. 28-35.
Windhorst, H.-W.: Mexiko´s egg industry. In: Zootecnica international 40 (March, 2018), p. 34-37.


