

The global egg industry and the global egg trade showed remarkable growth between 2015 and 2024. As can be seen from Table 1, production rose by 21.2 million mt[1], or 29.3%, during the period under review. Only the production volume of poultry meat grew even faster, at 23.5 million mt, although its relative growth rate of 22.4% was significantly lower. Beef and pork showed far less growth. The success of poultry products can be explained, on the one hand, by the fact that there are no religious restrictions on their consumption and, on the other hand, by the more favourable feed conversion ratio, which results in lower production costs.
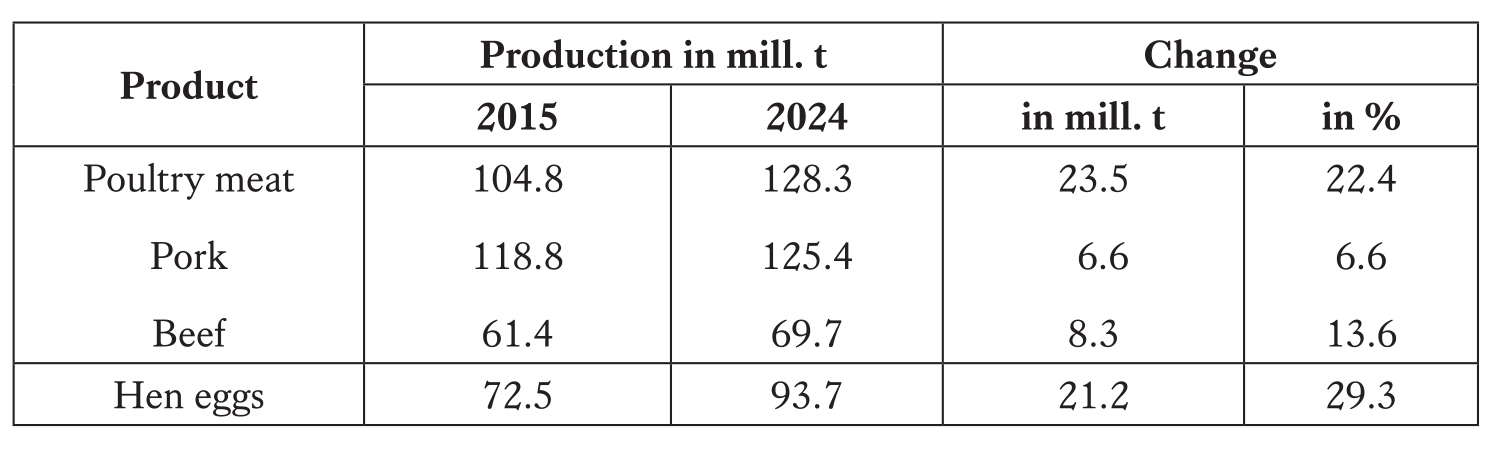
Source: FAO data.
Three articles will examine which continents or countries contributed most to the rise in production and what role they played in the trade with shell eggs. This introductory article examines the development of egg production. In four other articles, the author presented an analysis of the dynamics in global meat production and global meat trade (Windhorst, 2025, 2026). The findings in those articles can be used for comparison.
Rising production – but no continuous growth
Figure 1 shows that global egg production rose steadily between 2015 and 2024, but a closer look reveals that the annual growth rates varied. A high growth rate between 2016 and 2017 was followed by a year of economic turbulence with only a slight increase. This pattern was repeated in the wake of the COVID-19 pandemic from 2020 onwards, although this gave way to a renewed phase of rapid growth from 2023. However, it is likely that the massive outbreaks of avian influenza during the winter of 2024/2025 in North America, Europe and East Asia have once again dampened growth.
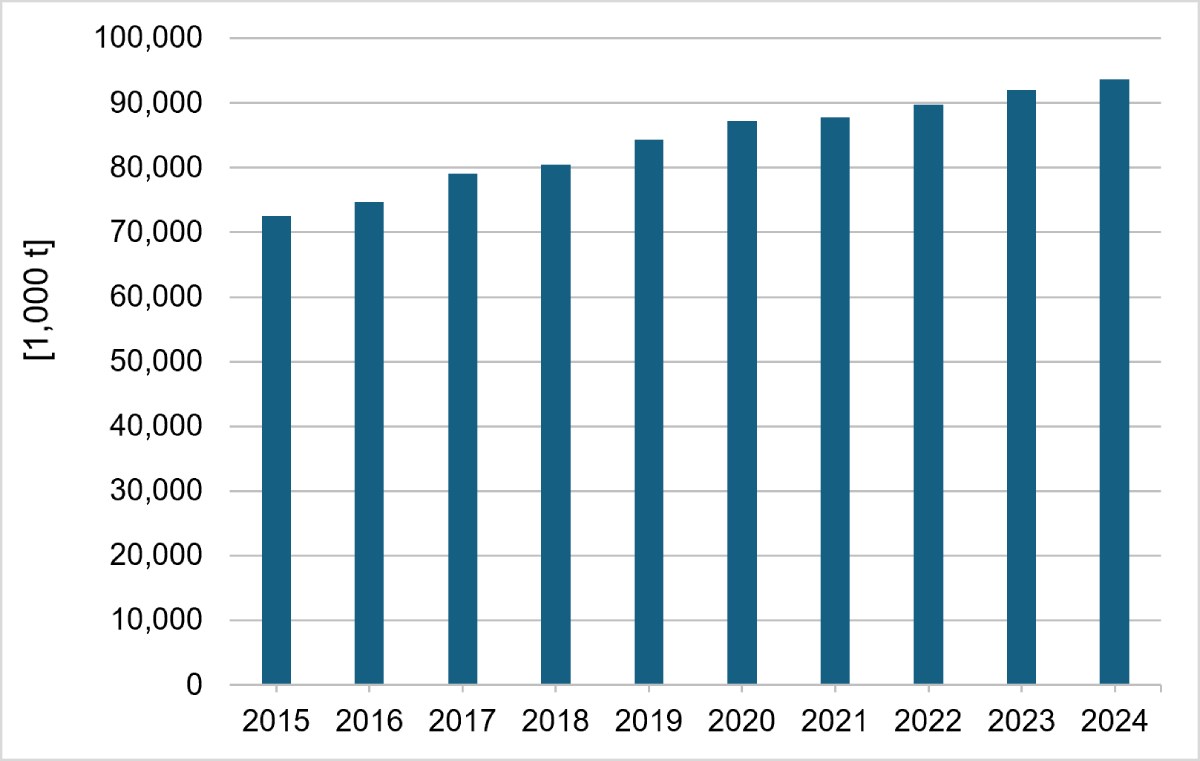
Design: A. S. Kauer, based on FAO data.
When analysing the data at the continental level, the differing contributions of each continent to the dynamics of global production become obvious (Figure 2, Table 2). Asia’s production volume rose by 16.41 million mt, or 38.0%, over the decade under review. This accounted for 77.0% of the global increase. Central and South America contributed 12.0% to global growth in egg production, with an increase of 2.56 million mt (30.3%). North America contributed 5.1%, adding 1.09 million mt. Africa recorded an increase of 758,000 mt (22.7%), accounting for 3.6% of global growth. Europe lagged behind, with an increase of only 478,000 mt (4.4%) and a contribution of just 2.2%.
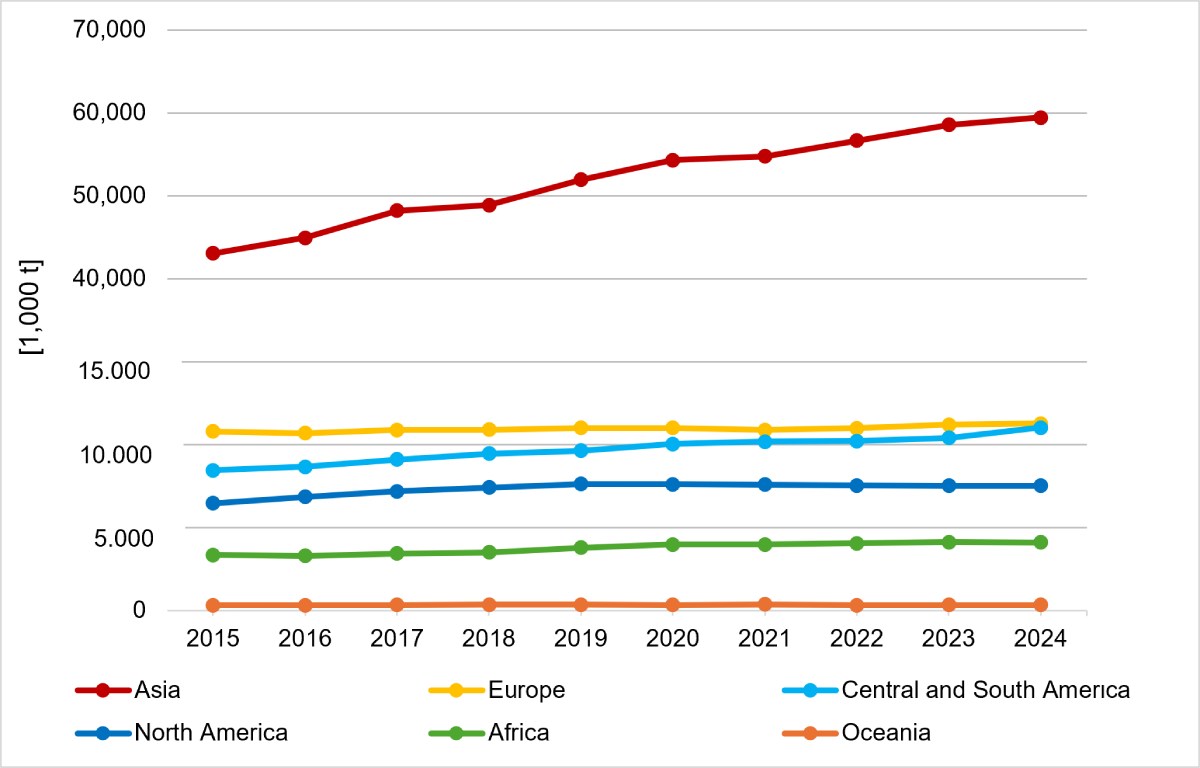
Design: A. S. Kauer, based on FAO data.
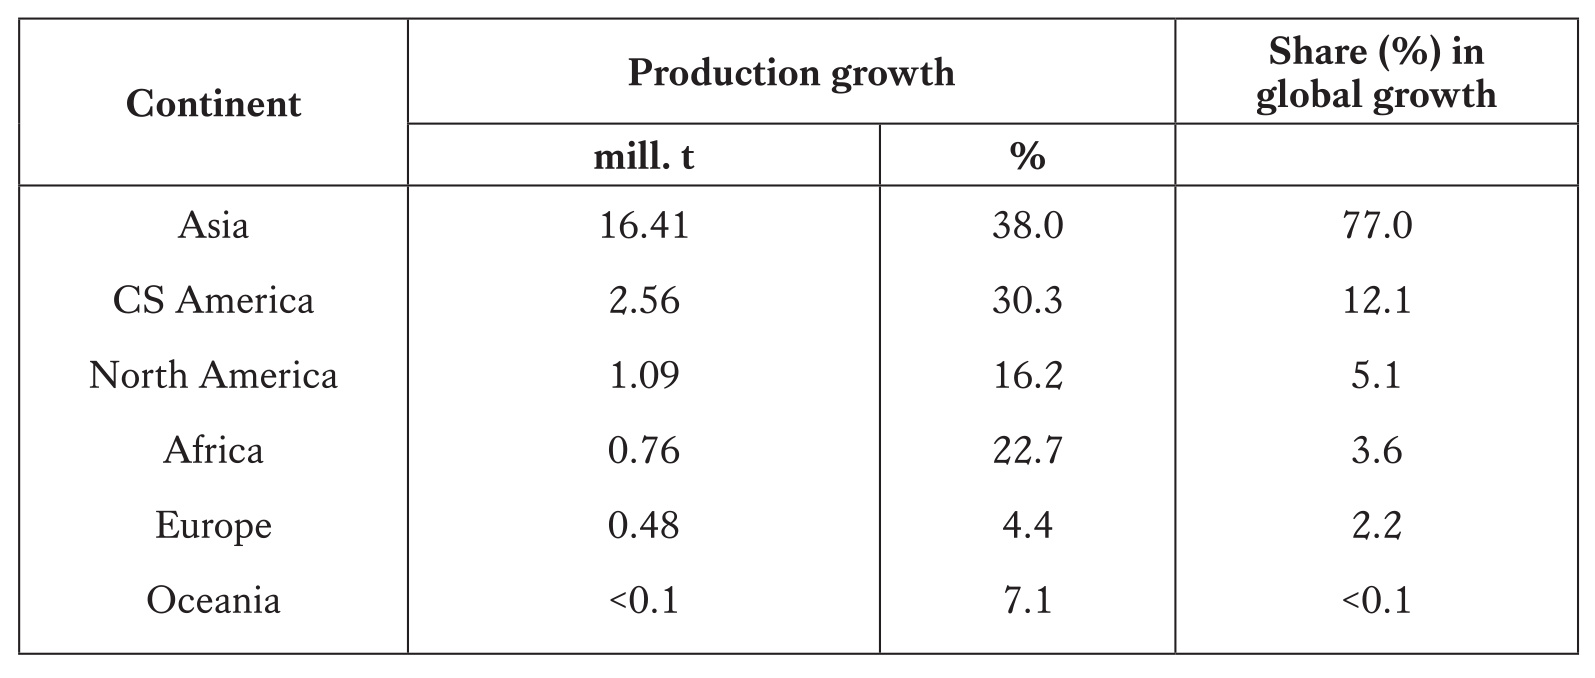
in the continents and their contribution to the global increase
Source: own calculations, based on FAO data.
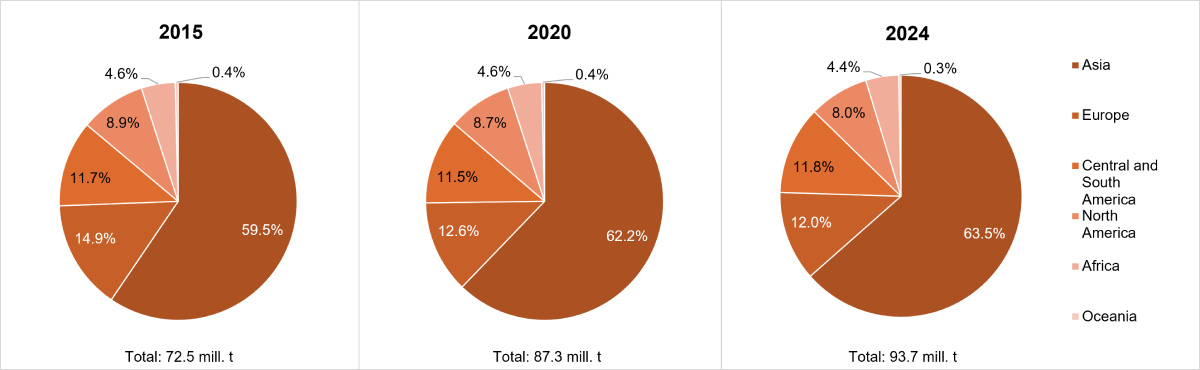
The widely varying trends in egg production across the continents resulted in a change of their share in global production over the ten-year period under consideration. Figure 3 shows that Asia’s share increased by 4.0%, whilst Central and South America’s by 0.1%. By contrast, the four other continents lost market shares. The decline was greatest in Europe at 2.9%, followed by North America at 0.9%. Africa and Oceania lost 0.2% and 0.1% respectively. A detailed analysis in the following section will show which countries in particular caused this change.
Design: A. S. Kauer, based on FAO data.
As an interim finding, it can be noted that egg production during the decade under review was characterised by remarkable growth. Only poultry meat showed a greater increase in production volume; however, the relative growth in egg production was higher. With regard to changes in the regional structure, it is noteworthy that Asia and Central and South America recorded the highest absolute growth rates. Asia occupied a unique position, accounting for 77.0% of global growth. Europe ranked by far last, with a contribution of just 2.2%, ahead only of Oceania.
The distribution of the continents’ contributions to global production reflects, on one hand, their share in the world’s population and, on the other, changes in egg consumption. Whilst per capita consumption in Europe and North America rose only slightly or even stagnated, most emerging economies recorded a further increase. In view of emerging population trends, the ongoing industrialisation of production and an increasing urbanisation – with the resulting shift in consumer behaviour – a growing demand for eggs and egg products is to be expected in the future.
Asian countries dominate the dynamics in global egg production
Given the exceptional role which Asia played in the increase of global egg production between 2015 and 2024, it was to be expected that Asian countries in particular would play a decisive role.
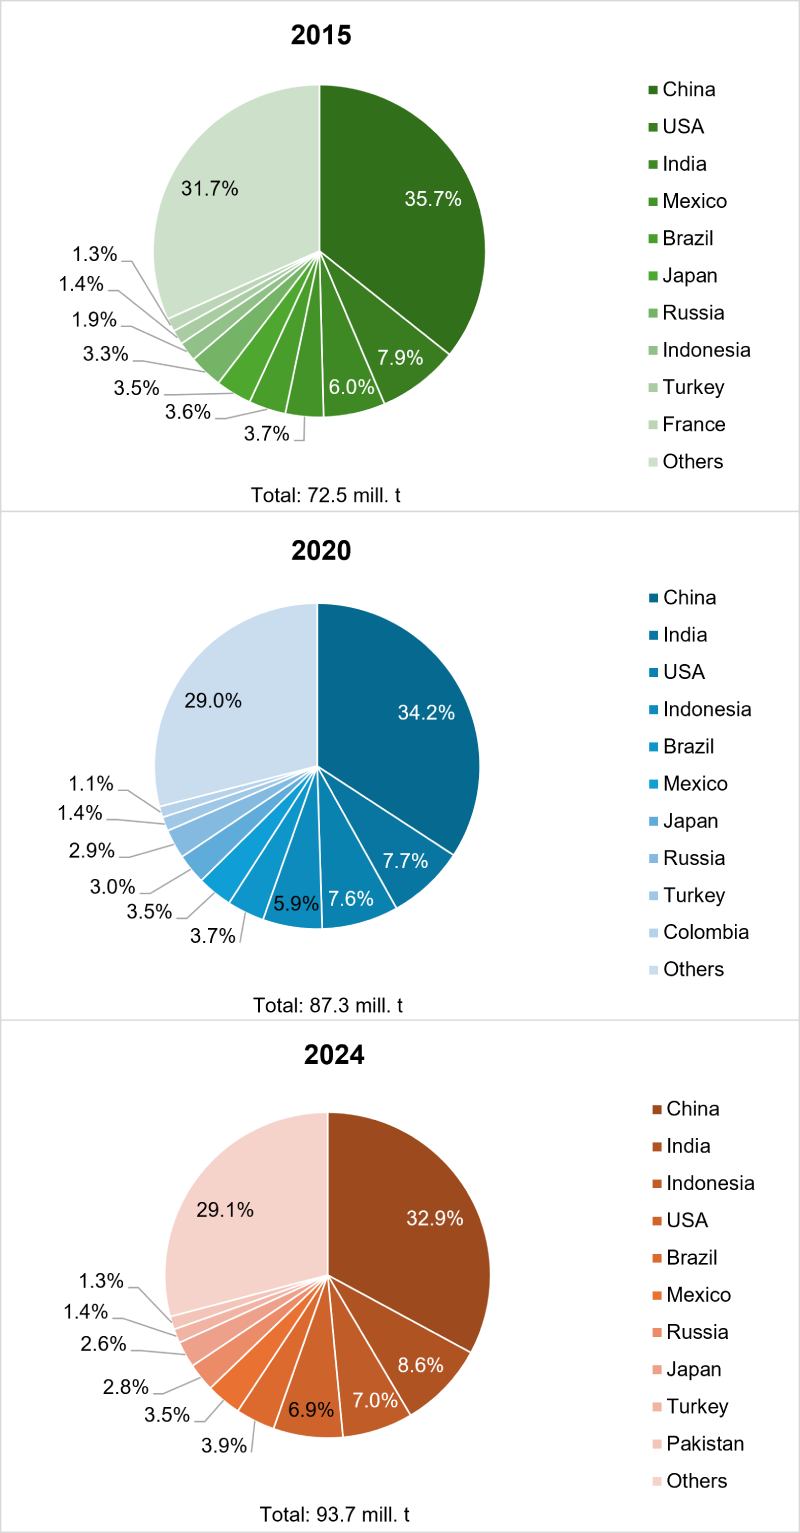
Figure 4 shows the shares of the most important egg-producing countries in global production. It is clear that there was a very high level of regional concentration overall, as the ten leading countries accounted for between 68.3% (2015) and 70.9% (2024) of global production; the three leading countries alone accounted for 49.6% (2015) and 48.5% (2024).
Design: A. S. Kauer, based on FAO data.
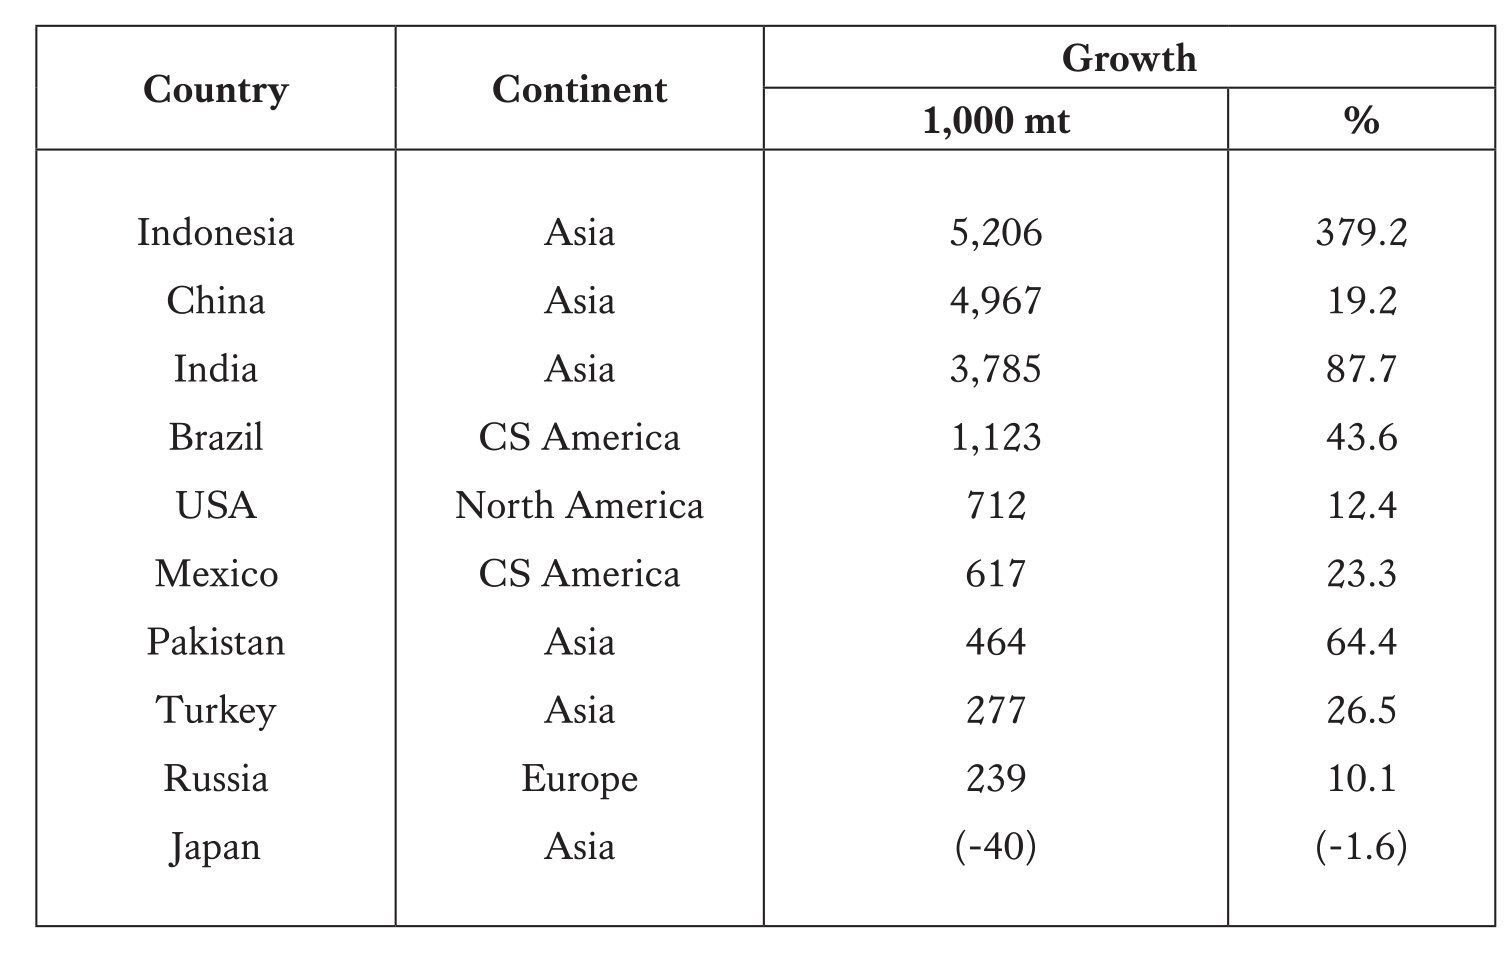
A detailed analysis of the development of egg production in the leading countries provides some interesting insights (Table 3).
Of the ten countries, six were in Asia, two in Central and South America, and one each in North America and Europe. The six Asian countries accounted for 14.7 million mt, or 69.1%, of the increase in production; the two countries in Central and South America accounted for 1.7 million mt, or 8.2%; the USA for 3.3%; and Russia for 1.1%.
Also of interest is the change in the ranking of the ten leading countries, as well as the change in their shares in global production over the ten years analysed here. China held the undisputed top position throughout the entire period. India and Indonesia displaced the USA from second place. Brazil was able to hold fifth place, while Mexico fell from fourth to sixth place, displacing Japan. France was no longer among the leading group in 2020 and 2024, while Pakistan moved into the group of the leading countries.
Source: own calculations, based on FAO data.
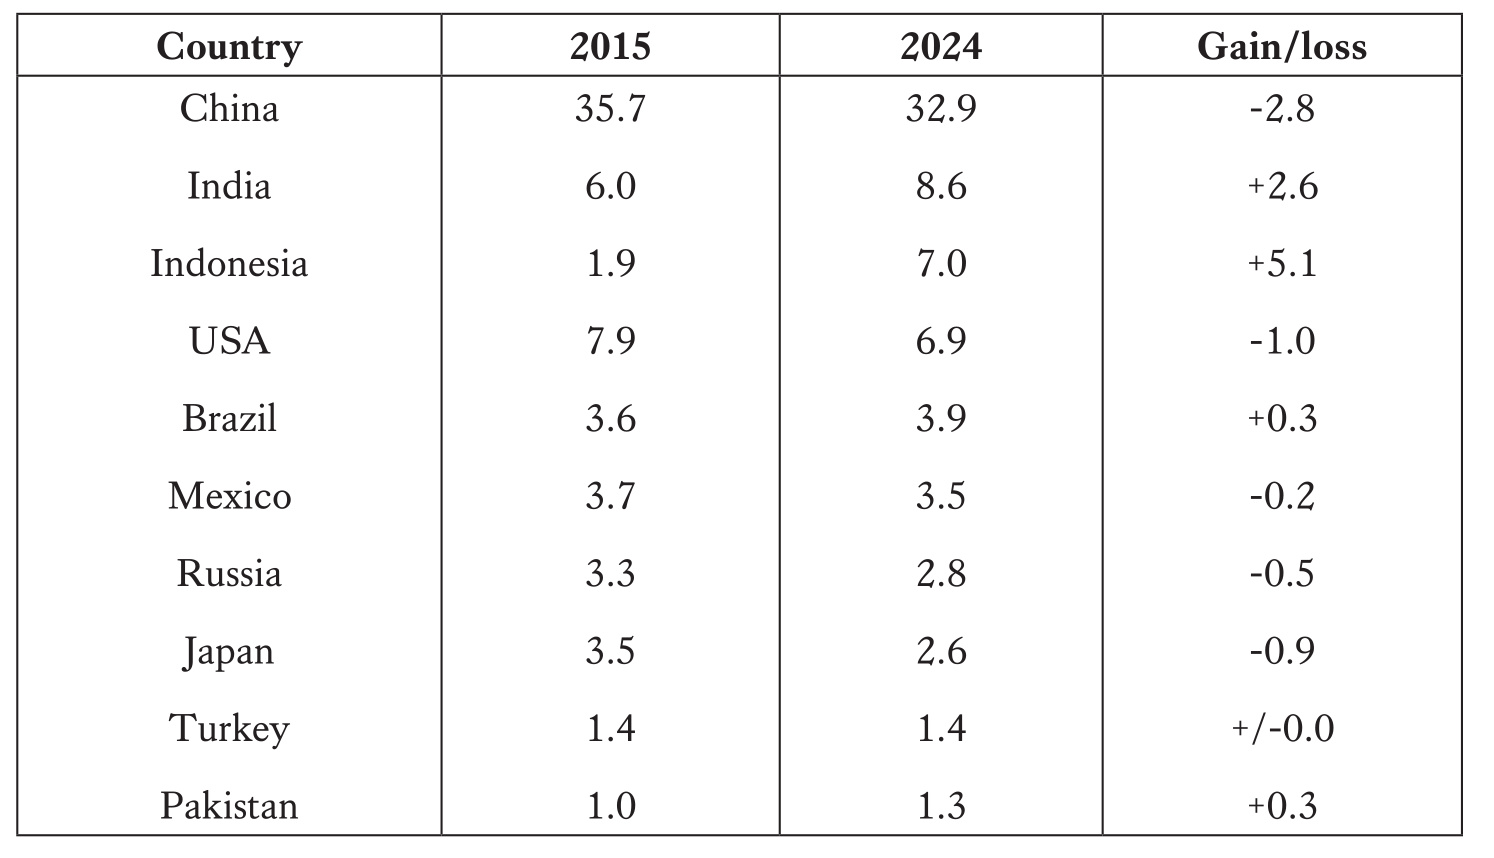
The differences in production trends led not only to changes in rankings, but also to losses or gains in market shares in global production. As can be seen from Table 4, only Indonesia, India, Brazil and Pakistan could increase their market shares; all other countries suffered losses. The rapid rise in production volumes in Indonesia, India and Brazil meant that, despite a remarkable increase in egg production, China lost 2.8% of its previous share.
Source: own calculations based on FAO data.
Summary and perspectives
The preceding analysis has shown that the strong growth in global egg production between 2015 and 2024 was driven by a relatively small number of countries. Rapid growth was observed particularly in some countries in East and South Asia, as well as in Central and South America, whilst growth in Europe and North America was significantly slower. At the country level, the rapid expansion of production volumes in Indonesia, India and Brazil is particularly noteworthy. Although China continued to occupy a unique position, it lost market share in global production due to the growth in other countries.
It is expected that global egg production will continue to rise rapidly over the next ten years. In a comprehensive study, Nan-Dirk Mulder (2025) forecasts an increase in global egg production between 2025 and 2035 from 96 million mt to 117 million mt, or by 22%. Of this, 81% is expected to come from emerging and developing countries, and only 19% from industrialised countries. The highest absolute growth is forecast for India, China, Indonesia and Brazil. These four countries are expected to account for around two-thirds of the anticipated global increase of 21 million mt. Population growth will remain a key driver of rising egg consumption in Africa, some Asian countries, and in Central and South America, as around 90% of this growth will occur in emerging and developing countries. The most important steering factors for the global egg industry’s dynamics over the next decade will be increasing urbanisation, rising egg consumption as a result of rising per capita income in emerging and developing countries, the growing importance of processed eggs, and the emergence of vertically integrated agro-industrial enterprises.
Data sources and supplementary literature
FAO. (n.d.). FAOSTAT. https://www.fao.org/faostat
Mulder, N.-D. (2025). Global egg industry outlook 2035: Long-term egg market and investment perspectives. Rabobank. https://www.rabobank.com/knowledge/q011497178-global-egg-industry-outlook-2035-long-term-egg-market-and-investment-perspectives
Windhorst, H.-W. (2026). The dynamics of global meat production: An analysis of the period from 2000 to 2023—Part 1: Production. Zootecnica Poultry magazine, 47(2), 20–26.
Windhorst, H.-W. (2026). The dynamics of global meat production: An analysis of the period from 2000 to 2023—Part 2: Exports. Zootecnica Poultry magazine, (3), 20–26.
Windhorst, H.-W. (2026). The dynamics of global meat production: An analysis of the period from 2000 to 2023—Part 3: Imports. Zootecnica Poultry magazine, (4), 16–20.
[1] 1 mt = 1,000 kg.