Five years after the banning of conventional cages in laying hen husbandry, the situation has stabilized in such a way that a status report on the patterns of egg production and trade can be presented.
The data is based on reports of the Committee for the Common Organisation of the Agricultural Market for Eggs. In this paper, an overview on the situation of the housing systems in the EU and egg production in 2016 will be given.
Housing systems in EU laying hen husbandry
 In 2016, 384.1 mill. laying hens were kept in EU member countries. Table 1 and Figure 1 document the share of the four housing systems which are used presently. Enriched cages are the dominating housing system with a share of 55.6%, followed by barn and free range
 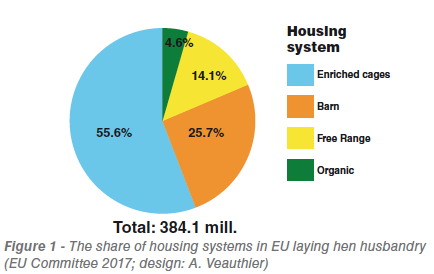 systems. The share of organic egg production is still very low with only 4.6 %.
The regional concentration of laying hen husbandry in the EU is quite high. The 10 member countries with the largest hen population shared 86.1 % of the total inventory (Table 2). Germany was in a leading position with 52.6 mill. hens, followed by France, Spain and Poland. These four countries contributed 48.8% to the EU laying hen population the leading seven countries 70.9 %. 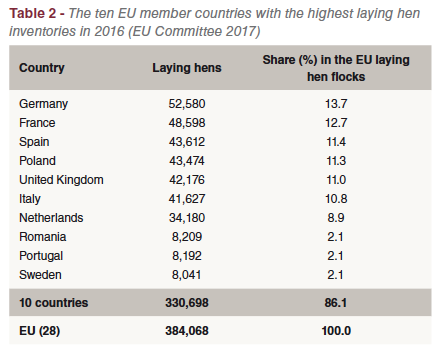 The laying hen inventory reflects the number of inhabitants.
In Table 3, the five member countries with the highest absolute share in each housing systems are documented. A comparison reveals the considerable differences between these countries. The number of laying hens in enriched cages was highest in Spain and Poland. Germany and the Netherlands were leading in barn systems, the United Kingdom and Germany in free range laying hen husbandry. The highest number of laying hens in organic husbandry was to be 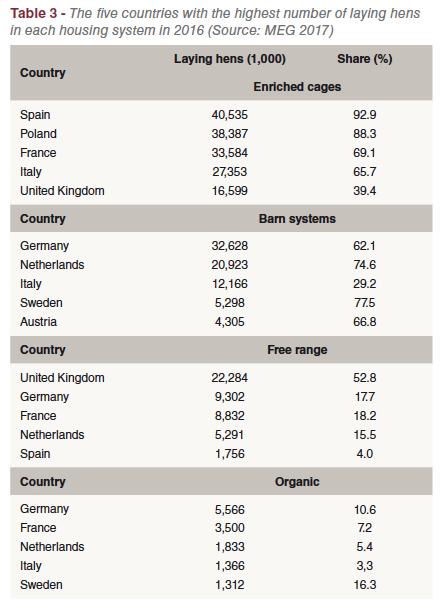 found in Germany and France. The highest relative share of enriched cages showed Lithuania (95.6%) and Spain (92.9%). In barn systems, Sweden (65.9%) and Austria (65.5%) were ranking in top positions. The United Kingdom (52.8%) and Ireland (40.5%) had the highest relative share of their laying hens in free range systems. Organic laying hen husbandry reached the highest share in Denmark (28.6%) and Sweden (16.3%). Figure 2 documents the great differences between the 28 EU member countries regarding the share of the four housing systems.
Patterns of egg production
Between 2012 and 2016, egg production in the EU increased from 7.0 mill. t to 7.5 mill. t or by 6.1% (Table 4). The growth was not homogeneous. Between 2012 and 2013, after the banning of conventional cages, the production volume grew by 3.6%. In the following years, the growth rate was considerably lower with only 1.4% between 2013 and 2014, 1.0% between 2014 and 2015 and only 0.1% between 2015 and 2016.

In Table 5, the ten leading EU countries in egg production in 2016 are listed. A comparison with the layer flocks (see Table 2) reveals some differences. They are a result of the wide  difference in the share of housing systems in the member countries. France ranks in an unchallenged first place, followed by Germany, Spain and Italy. The regional concentration in egg production is rather high. The ten leading countries share 84.4% in the overall production volume of the EU. With the exception of the Netherlands, the ranking in production reflects the ranking in population.
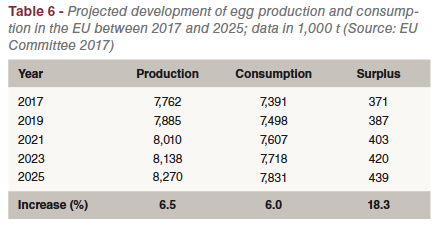 A projection of production and demand until 2025
In Table 6, a projection of the development of production and demand until 2017 is presented. One can easily see that egg production in the EU will grow faster than consumption. This will result in an increasing surplus. If this surplus cannot be exported either as shell eggs or as egg products, a lasting period of low egg prices could be the result. Despite the comparatively high prices, high-quality egg products should find a market, however.
References and additional literature are available on request


