

Feed is the single biggest cost to a turkey operation, 60% to 70% of the cost of production is related to feed, with energy and protein considered the main contributors to this cost.
Adequate energy and amino acids should be provided in the diet to support bird performance. However, there is a need to understand the bird’s response to these nutrients in order to achieve the best economic outcome.
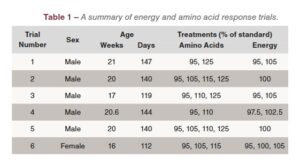
Aviagen Turkeys, in collaboration with their research partners, have conducted a number of trials assessing the impact of various energy and amino acid densities on turkey performance. Each of these trials assessed different nutrient levels. Table 1 shows the amino acid and energy levels assessed. Nutrient levels are expressed as a percentage of breed standard, 100% representing the BUT6 breed standard.
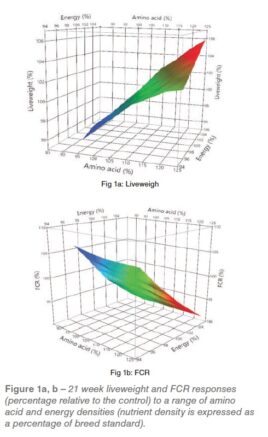
 The performance data from these trials were collated to assess the response of turkeys to a range of nutrient densities. The surface plot graph (see Figure 1a, b) shows liveweight and FCR (feed conversion ratio) are responsive (expressed as percentage relative to the 100% control) to both amino acid and energy density. Both the liveweight and FCR responses are optimised at the highest nutrient densities, 125% and 105% of breed recommendations for both amino acid and energy density respectively. The surface plot graph also shows that energy density appears to impact positively on the response to increasing amino acid concentration suggesting that diet energy density should be considered at high amino acid densities.
 The response to other attributes were also established including processing traits. As with liveweight and FCR, increasing nutrient density had a positive impact on breast meat yield (see Figure 2). At lower energy densities breast meat yield (BMY) showed a curvilinear response to increasing amino acid density. However, as with the liveweight and FCR responses, BMY continued to respond to increasing amino acid concentration at higher energy densities. Again, this reinforces the importance of energy density when optimising the processing response to amino acid density.
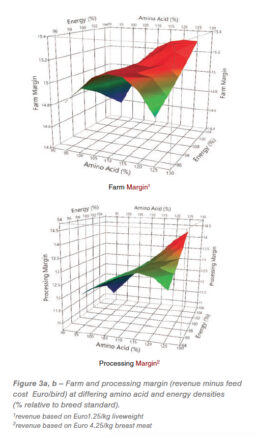
 Having established performance responses to different nutrient densities, economic responses can be derived. Margin (after feed cost) is calculated by estimating the difference between revenue (value of live bird or meat) and feed cost at each nutrient density. By examining the profile of the surface plot graph (Figure 3a) the effect of nutrient density, on farm margin can be appreciated. The same approach can be taken to derive an estimate of margin for processed products. Margin was estimated at each nutrient density based on revenue (the value of breast meat yield) minus feed cost per bird (Figure3a).
- Higher farm and processing margins are achieved at or above breed standards relative to lower nutrient levels. However increasing both amino acid and energy density further increases margin.
- Increasing one nutrient without a concomitant increase in the other nutrient results in lower margin.
- Decreasing both energy and amino acid density results in lower margin.
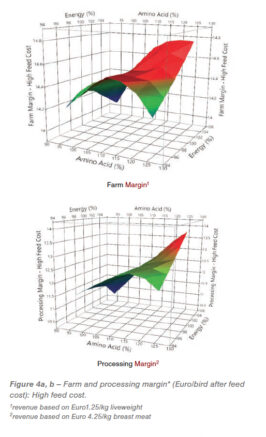
These assessments were based on one specific cost base. Raw material feed costs fluctuate and will impact on margin so in order to assess this effect both farm and processing margins were examined at higher feed costs. The price of protein, cereal and cereal by-products were increased in cost by a minimum of 10% to reflect typical ranges in raw material costs over a three-year period. Figure 4a,b shows both the farm and processing margin profile remain unchanged relative to the margin profile at lower feed costs. Both farm and processing margin are still higher at breed standard relative to lower nutrient levels and optimised at the highest nutrient densities. This shows that the margin response to nutrient density is ‘resilient’ to altering raw material price changes and suggests that nutrient density should not be reduced below the breed standard when raw material costs increase.
 Assessments have also been made based on altering revenues, liveweight revenue was reduced by 10% relative to the existing revenue base. The optimal farm margin is still orientated towards higher energy and amino acid concentrations (Figure 5) and suggests that although the revenue base may change significantly there appears to be little basis to alter nutrient density dramatically.
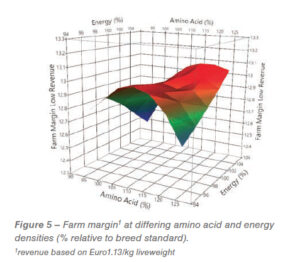
- The data demonstrates the ability of the modern bird to respond to a wide range of nutrient levels.
- Liveweight, FCR and breast meat yield are responsive to nutrient density and show optimal responses on or above breed standards.
- Based on the example scenario, feeding to the breed standard achieves higher margin relative to lower nutrient densities. Increasing both amino acid and energy density above breed standard results in further improvement of margin.
- Deviation in nutrient density below breed standard significantly reduces both farm and processing margin.
- The margin response to nutrient density remains similar at elevated feed costs suggesting nutrient density should not be significantly reduced when raw material prices increase.
- The margin response to nutrient density is consistent at differing revenue levels suggesting nutrient density should not be reduced below breed standard when revenue decreases.
- Collating trial response data provides a means where by both biological and economic responses can be assessed at different nutrient densities. Using this approach nutritionists can make informed decisions about the nutrient density to feed to commercial turkeys for a given set of circumstances.


