
In 2015, the 28 member countries of the EU shared 6.8% in the global population but contributed 15.7 % to global meat production and 12.0% to global poultry meat production. This comparison documents not only the intensity of meat production in the EU but also the high per capita consumption.
In this paper, the dynamics in EU poultry meat production and trade between 2010 and 2015 will be analysed; in addition, a projection of poultry meat production, consumption and trade until 2025 will be presented.
Meat surplus in the EU
 In 2015, the EU member countries had a meat surplus in relation to consumption of about 5.8 mill. t, which resulted in a self-sufficiency rate of 113.2%. Table 1 documents the differences between the single meat types. While production and consumption were quite balanced in beef and veal, pig meat showed a self-sufficiency rate of 110.0% and poultry meat of 104.4%. A comparison of the per-capita consumption reveals that with 41.9 kg/person and year, pig meat is still preferred by the consumers. The per capita consumption of poultry meat with 22.5 kg is much lower.
Considerable increase in poultry meat production
 Between 2010 and 2015, poultry meat production in the EU increased by 1.3 mill. t or 10.4%. The highest absolute growth showed broiler meat with 1.4 mill. t or 14.4%. In contrast, turkey meat production decreased by 10,000 t or 0.5%.
Broiler meat shared 79.0% in total poultry meat production of the EU in 2015, turkey meat 13.8% and duck meat 3.5%.
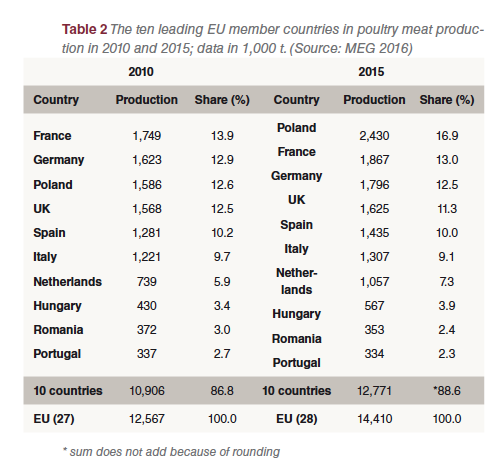
A comparison of the ranking of the ten leading countries in 2010 and 2015 shows that France was replaced by Poland as the number one poultry meat producing country (Table  2). In the leading countries, the production volume grew by more than 1.8 mill. t or 14.7%. Poland had the highest absolute increase with 844,000 t, followed by the Netherlands (318,000 t) and Spain (154,000 t). In Figure 1 the spatial distribution of poultry meat production in the EU is documented.
Remarkable dynamics in EU poultry meat trade
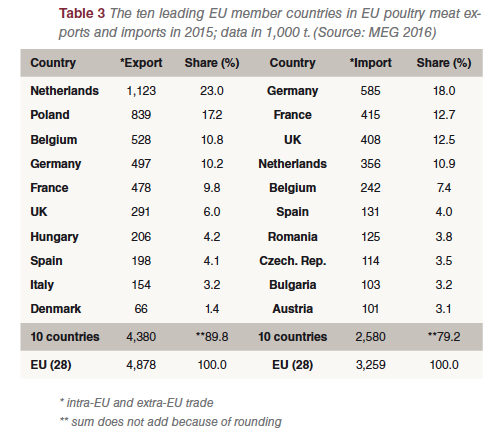 The following chapter analyses the foreign trade of the EU with poultry meat. In Table 3, the ten leading exporting and importing countries in 2015 are listed. In this table, intra-EU trade and trade with non-EU countries are summarized. The regional concentration is very high. The ten leading countries shared 89.9% in the export volume, the first three 51.0%. In imports, the regional concentration was lower. The ten leading countries shared 79.2% in the overall import volume, Germany and France together 30.7%.
Considerable increase in trade with non-EU countries
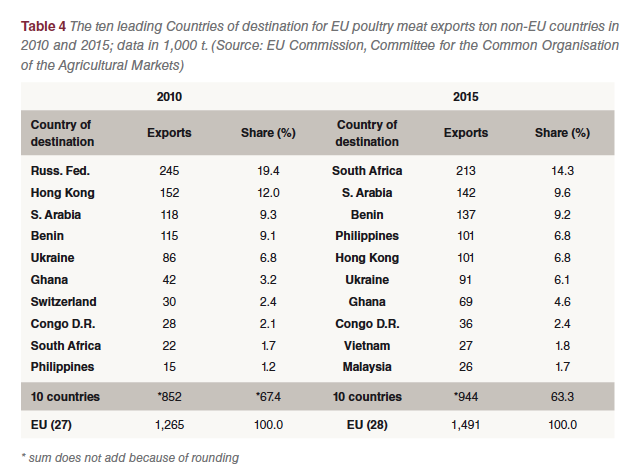 Between 2010 and 2015 poultry meat exports to non-EU countries increased from 1.27 mill. t to 1.49 mill. t or by 17.9% (Table 4). The decrease in the regional concentration is a result of the import embargo by the Russian Federation. New markets had to be found for the 245,000 t which Russia had imported in 2010. A comparison of the composition and ranking of the ten leading countries of destination shows the growing importance of African and Asian countries. In 2015, only Ukraine was left as a European country. Exports to South Africa, Philippines, Ghana and Saudi Arabia increased considerably.
With a volume of 872,000 t, poultry meat imports were much lower than exports. Brazil (499,000 t) and Thailand (275,000 t) were the two leading countries origin for the Imports. They contributed 88.7 % to EU imports in 2015. Because of the fast growth of the poultry meat exports in the analysed time period, the export surplus in poultry meat trade with non-EU countries increased from 444,000 t in 2010 to 619,000 t in 2015 or by 39,4%. This documents as well the oversupply in the EU as the growing demand for poultry meat in several less developed and threshold countries.
Further increase of production and consumption predicted
 It is expected that poultry meat production in the EU will increase by 722,000 t or 5.3% between 2015 and 2025, consumption by 660,000 t or 5.1%. This will result in a growing trade surplus from 569,000 t in 2015 to 631,000 t in 2025 (Table 5).
In contrast to the development in the EU, global poultry meat production and consumption will grow by 16.2% resp. 16.6%. Production will reach a volume of 131.3 mill. t and poultry meat will then have surpassed pig meat production for which a production volume of 131.0 mill. t is projected. The extraordinary growth of poultry meat production is mainly due to the fast increase of production and consumption in several less developed and threshold countries (see Windhorst 2016a, b).
Summary
The main results of this analysis can be summarized as follows:
– In 2015, poultry meat production in the EU surpassed consumption by 569,000 t.
– Poultry meat production grew by 10.4 % between 2010 and 2015 and reached a volume of 14.3 mill. t.
– Broiler meat production increased in particular. In 2015, it contributed 79.0% to the overall poultry meat production in the EU.
– Poland and France were the leading poultry meat producing countries. In 2015, they contributed 29.9% to the EU production volume.
– Intra-EU trade with poultry meat and trade with non-EU countries grew considerably in the anlaysed time period.
– The main non-EU countries of destination in 2015 were African and Asian countries; poultry meat is mainly imported from Brazil and Thailand.
– Between 2015 and 2025 a growth rate in EU poultry meat production of 5.3% is predicted. It will, however, be much lower than the global growth rate of 16.2%.
References are available on request.


 in layers")


