
In two papers the dynamics of global poultry meat trade will be analysed in detail. The first paper (see here) documented the dynamics at continent and country level. This paper will analyze patterns and dynamics at the level of the development status of countries.
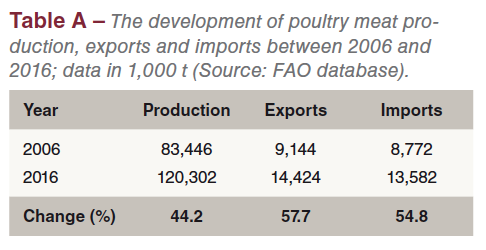
The relative growth rates in exports and imports were even higher than that in production (Table A). The lack of religious barriers, the excellent feed conversion, the broad variety of meals and the worldwide use in fast food restaurants are the main steering factors behind the ongoing success.
The dynamics of poultry meat trade at Country Development Group (CDG) level
Although most of the data is available at continent and country level, it is not very satisfying, as it does not show the different roles of developing, threshold and industrialised countries. In 2016, the author developed a new method of classifying countries. This classification was very well accepted and therefore used in several publications and presentations in the following years.
The classification of the 211 countries for which data sets are available is based on several parameters, i.e. gross national product, personal income, purchasing power, life expectancy, infant mortality etc. The countries were classified in four Country Development Groups (CDG):
- LLDC = Least Developed Countries
- LDC = Less developed countries
- NIC = Newly industrialised or threshold countries
- OIC = Old industrialised countries
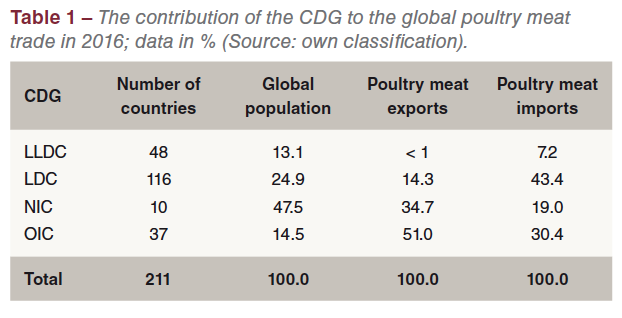
The data in Table 1 reveals the considerable imbalance between the share of the four CDG in global population and poultry meat trade. The 164 developing countries shared 38.0% in the global population but only 14.4% in global poultry meat exports but 50.6% in poultry meat imports.
On the other hand, the 37 old industrialised countries contributed only 14.5% to the population but shared 51.0% in the global exports of poultry meat and 30.4% in the imports of this commodity. It is worth noting that the 10 threshold countries contributed 47.5% to the global population, 34.7% to the global export volume but only 19.0% to poultry meat imports. In the following detailed analysis, the changing roles of the four CDG in global poultry meat trade will be documented.
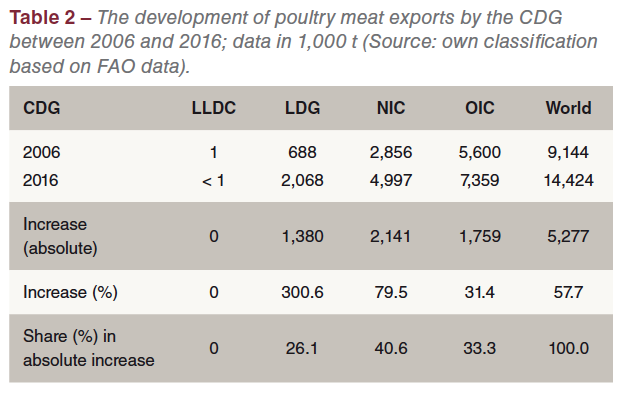
Table 2 shows that global poultry meat exports increased from 9.1 mill. t in 2006 to 14.4 mill. t in 2016 or by 57.7%. In 2006, the OIC dominated global poultry meat exports with a share of 61.2%, followed by the NIC with 31.2%. The developing countries played only a minor role in the global exports of this commodity. Ten years later, the situation had changed considerably. The contribution of the OIC decreased by 10.2%. On the other hand, the NIC gained 3.6% in the global share, the LDC even 6.8% (Figure 1). In the next chapter the countries which were responsible for the change will be identified.
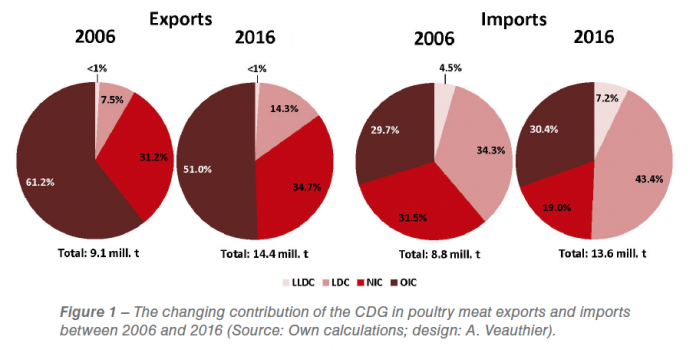
To the absolute increase of the global export volume, the NIC contributed 40.6%, the OIC 33.3% and the LDC 26.1%. This documents that the OIC lost in importance in the global exports of poultry meat while some NIC and LDG were able to gain market shares based on an increasing production.
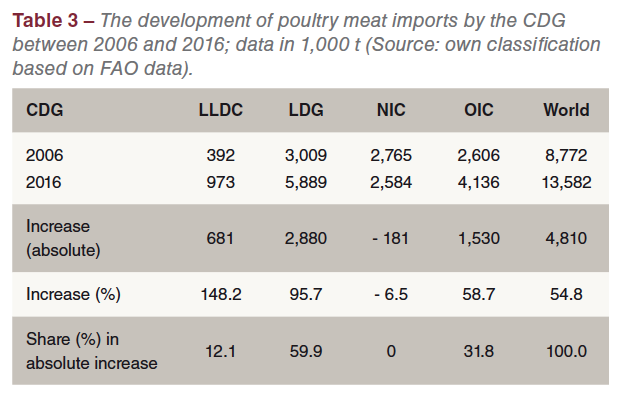
Poultry meat imports grew by 4.8 mill. t or 54.8% between 2006 and 2016 (Table 3). In 2006, the LDC shared 34.3% in the global import volume, followed by the NIC with 31.5% and the OIC with 29.7% (Figure 1). Ten years later the situation looked quite different. The LDC had expanded their imports considerably, sharing 43.3% of the total imports. The share of the OIC remained fairly stable while the NIC lost 12.5% of their former share. The LLDC became more attractive market for the poultry meat exporting countries. In 2016, they already shared 7.2% of the global import volume; 2.5% more than in 2006 (Figure 1).
To the increase of the global poultry meat imports the LDC contributed 59.9%, the OIC 31.8% and the LLDC 12.1%. In contrast, the imports of the NIC fell by 6.5%. This dynamics reflects the growing demand in the developing countries which they could not meet by domestic production. On the other hand, poultry meat production in the NIC was obviously not only able to meet the growing demand but could increase their exports considerably as is documented in Table 2. The situation in the OIC is very interesting. They contributed 33.3% to the global exports and shared 31.8% in the imports. The next chapter will show which countries were the main driving forces behind this dynamics.
The dynamics of poultry meat trade at the level of the country development status
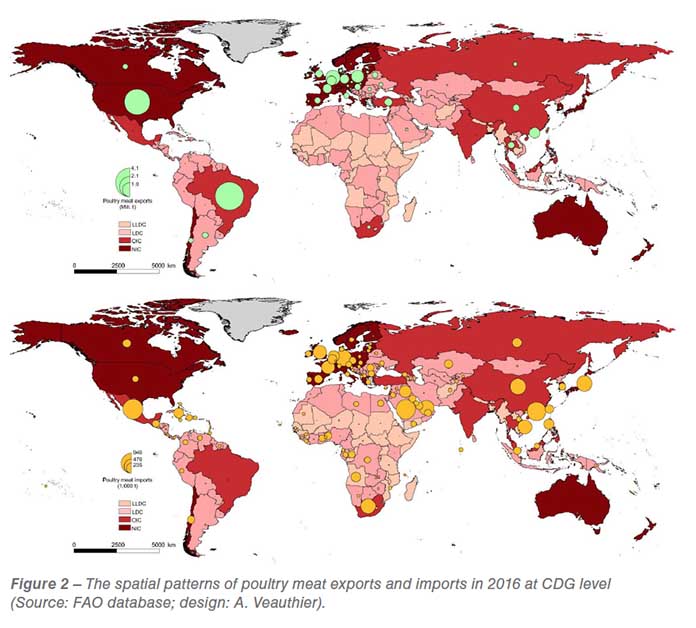
The following chapter will analyze the dynamics at the level of the development status of the countries. The spatial patterns of exports and imports are shown in Figure 2.
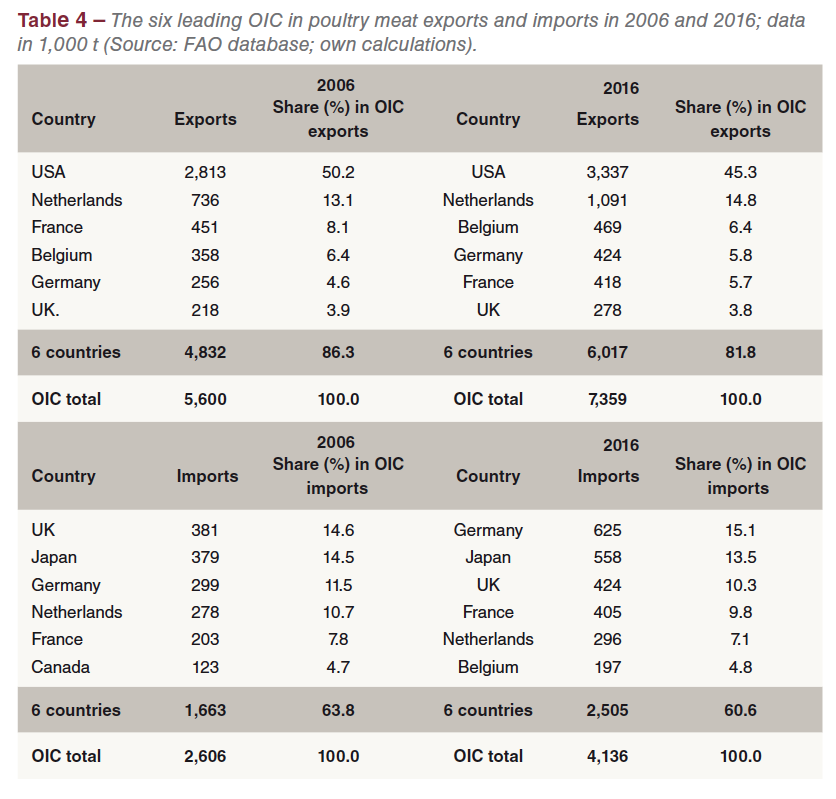
From the data in Table 4 one can see that with the exception of the USA EU member countries were in leading positions regarding poultry meat exports. The USA, France and the United Kingdom lost shares in the overall exports of the CDG while the Netherlands and Germany gained shares. The regional concentration was very high even though it fell by 4.5% in the analysed decade. The regional concentration in imports was much lower, indicating that several OIC were not able to meet their growing demand by domestic production. All six countries expanded their imports. A comparison of the export and import patterns easily reveals that the intra-EU trade with poultry meat was very important in this CDG.
The NIC ranked second behind the OIC in global poultry meat exports in 2006 and 2016. In 2006, Brazil contributed 93.3% to the export volume of this CDG, followed by China and Turkey. Ten years later, Brazil had lost 12.1% of its former share despite an increase in its exports by 1.4 mill. t. This is a result of the fast growth of Turkey’s, China’s and Thailand’s exports. Turkey’s contribution to the overall exports of the NIC increased by 5.0% that of Thailand by 4.0% (Table 5).
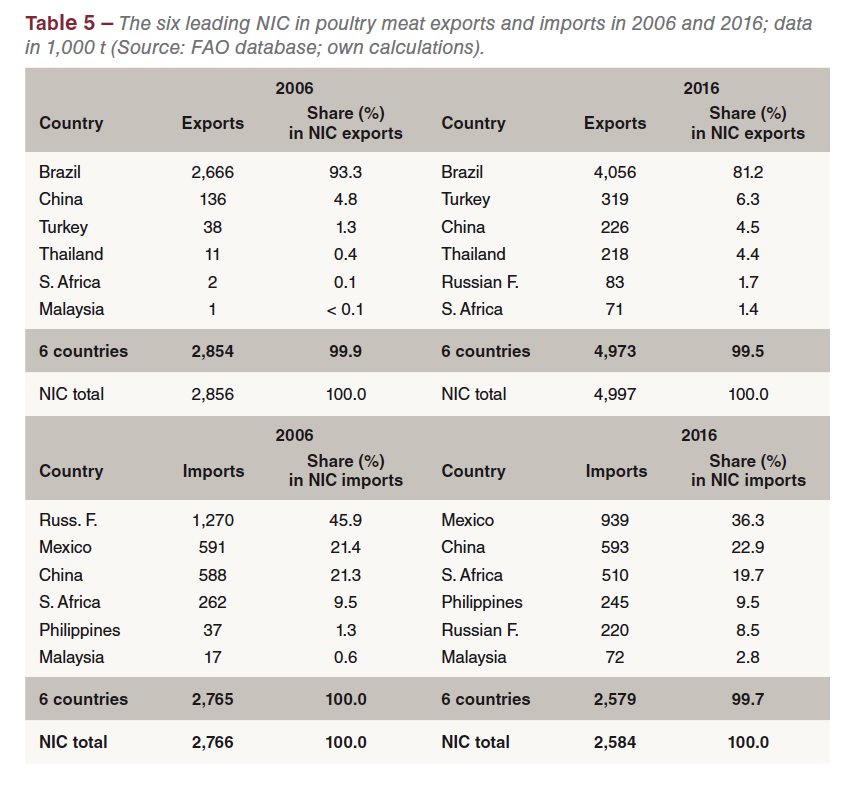
In 2006, the Russian Federation was the leading poultry meat importing country with a share of 45.9% in the total export volume of this CDG, followed by Mexico and China. In 2016, the Russian Federation ranked as umber five with a share of only 8.5%. The remarkable growth of broiler meat production and the import embargo against EU member countries, the USA and Canada were the steering factors behind this dynamics. Mexico ranked in first place among the leading importing countries of this group, followed by China and South Africa. Together the three countries shared 78.9% of the total poultry meat imports of the NIC. Mexico’s share in the imports of this CDG increased by 14.9% that of South Africa 10.2% and that of the Philippines by 8.2% (Table 5). The fast growing demand could not be met in these countries by their domestic production.
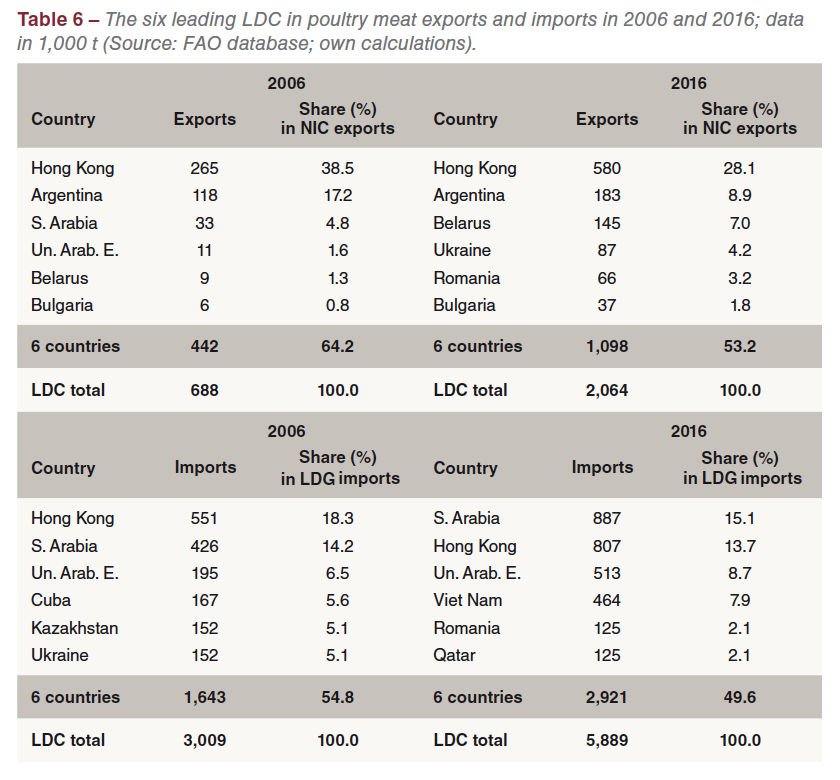
The LDC played only a minor role in global poultry meat exports in 2006 with a share of 7.5%. Within ten years they could almost double their share because of the remarkable growth of the export volumes in Hong Kong, Argentina, Belarus and Ukraine. The regional concentration in the exports of this CDG decreased considerably which indicates that a growing number of countries were able to expand their production faster than their domestic demand. The ranking of Hong Kong in exports and imports demands an additional explanation. Hong Kong was importing and exporting poultry meat. About two thirds of the imports were re-exported, mainly to Taiwan and Viet Nam. To classify Hong Kong among the LDC is a problem. As it is not a member of the ten NIC and not an OIC, it was listed in this classification as a LDC which may be challenged.
Poultry meat imports of the LDC increased by 2.8 mill. t which documents the growing demand of this commodity in developing countries. Islamic countries in Western Asia and some Eastern Asian countries were the main markets for the exports of the NIC and OIC with a considerable production surplus.
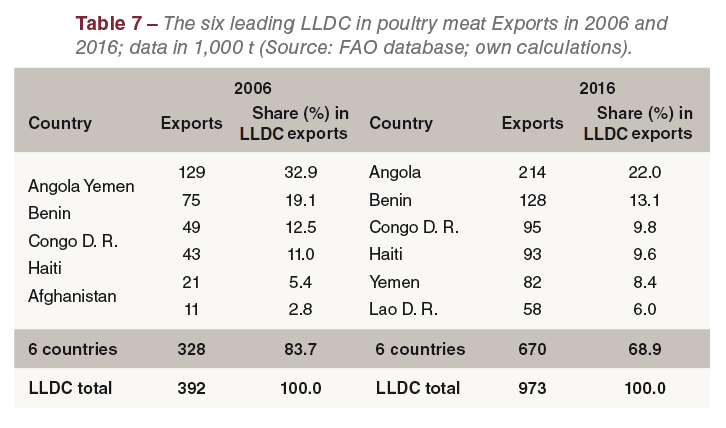 As was to be expected, LLDC are not able to export poultry meat because of their development status. Therefore, only the dynamics in imports are analysed. The share of this CDG in global poultry meat imports increased from 4.5% in 2006 to 7.2% in 2016 (see Figure 1). Between 2006 and 2016, the regional concentration decreased by 14.8%. This indicates that a growing number of the LLDC were forced to import poultry meat because of the share of only 2.6% of this CDG in global poultry meat production and the fast increasing demand.
Summary and perspectives
The preceding analysis could demonstrate that the analysis at the level of the development status of the countries is able to reach a better understanding of the dynamics in poultry meat trade. While the exports of this commodity are still dominated by the OIC, Brazil and Turkey, both members of the NIC group, gained in importance. Poultry meat imports by the NIC countries decreased during the analysed time period, indicating that they were able to better balance production and demand. The share of the OIC in imports did not change very much between 2006 and 2016. The intra-EU trade was the main contributor to the increasing import volume.
A remarkable dynamics can be observed in the development of the poultry meat imports by developing countries. In 2016, the LLDC and LDC together shared 50.6% in the global import volume. This documents the important role of poultry meat in supplying the fast growing population in these two CDG with animal protein. It can be expected that with an increasing purchasing power of an expanding middle-class the role of developing countries in poultry meat trade will gain in importance.
Data source and additional literature
Windhorst, H.-W.: The Globalisation of Egg and Poultry Meat Production. An Analysis on Country Development Group Level. London: International Egg Commission 2017. 35 p.
Windhorst, H.-W.: Brazil: considerable increase of broiler meat and egg production. Part 2: Trade. In: Zootecnica International 39 (2017), no. 9, p. 20-23.
Windhorst, H.-W.: Dynamics and patterns in EU and USA egg and poultry meat production and trade. (= WING Beiträge zur Geflügelwirtschaft Heft 17). Vechta 2017. 76 p.
Windhorst, H.-W.: Patterns of EU poultry meat production and consumption. A 2016 status report. In: Zootecnica International 40 (2018), no. 1, p. 20-23.
FAO database: http://www.fao.org/faostat.