
In two papers the dynamics of global poultry meat trade will be analysed in detail: in this first article the dynamics at the continental and national level will be documented.
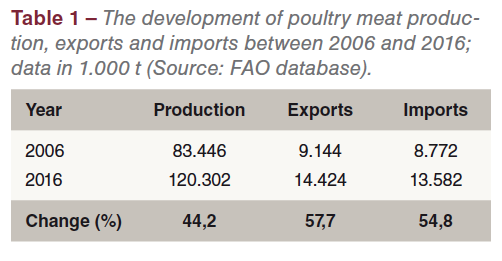
The relative growth rates in exports and imports were even higher than that in production (Table 1). The lack of religious barriers, the excellent feed conversion, the broad variety of meals and the worldwide use in fast food restaurants are the main steering factors behind the ongoing success.
The dynamics of poultry meat trade at continent level
In a first step, the dynamics of poultry meat trade at continent level will be analysed. In 2006, 11,0% of global poultry meat production was traded; in 2016 the traded volume reached 12,0%.
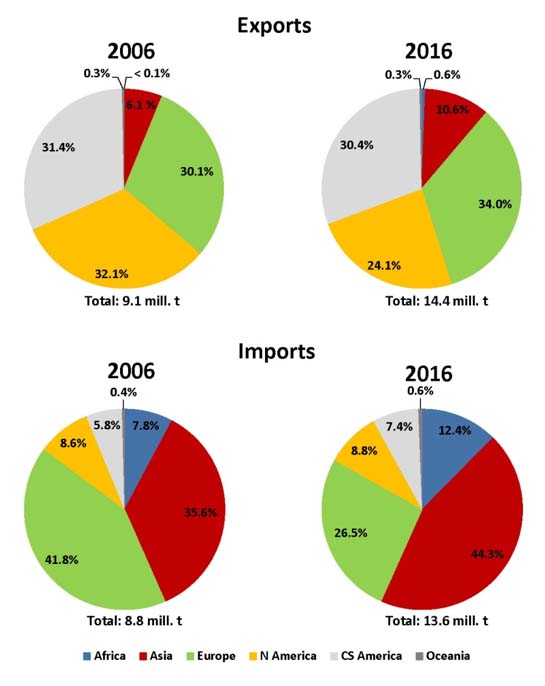
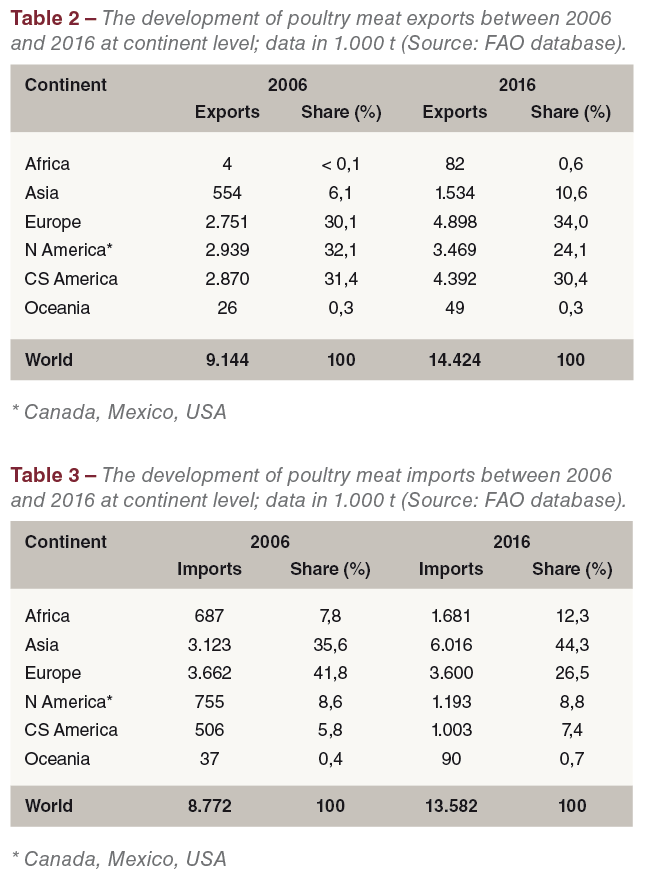 Table 2 shows that poultry meat exports increased from 9,1 mill. t to 14,4 mill. t or by 57,7%. In 2006, Europe, North America and Central and South America shared 93,6% in the global export volume. Ten years later, exports from Asian countries had grown considerably, sharing 10,6% of the global exports. While the Americas lost 9,0% of their share in 2006, Asia gained 4,5% and Europe 3,9%. Global poultry meat exports increased by 5,3 mill. t. To this growth, Europe contributed 2,1 mill. t or 40,7%, followed by Central and South America (28,8%) and Asia (18,6%). The three North American countries shared only 10,3% in the absolute increase.
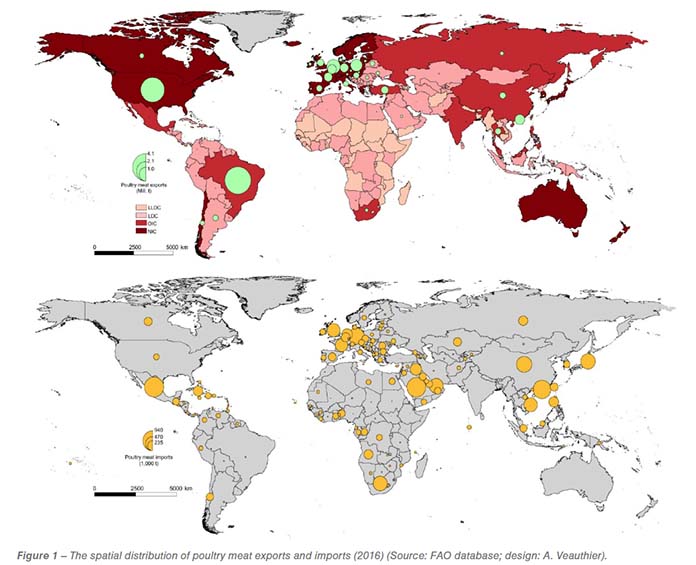
The regional pattern of poultry meat imports differs considerably from that of exports as can be seen from Table 3 and Figure 1. In 2006, European and Asian countries dominated imports with a share of together 77,4%. In 2016, the situation had changed thoroughly. Europe lost 15,3% of its former share; Asia gained 8,7% and Africa 4,5%. The contribution of North America did not change much, but Central and South America almost doubled its import volume, gaining 1,6% in the global import volume (Figure 2). It is worth noting, that Europe’s poultry meat imports remained at the same level, while Asia imported 2,9 mill. t more in 2016 than in 2006. In the following chapter, it will be documented which countries were the driving forces behind this dynamics.
The dynamics of poultry meat trade at country level
In this chapter, the dynamics of poultry meat trade between 2006 and 2016 will be analysed. The main goal is to identify the countries which contributed to the fast growth of the export volume or were the main poultry meat importing countries.
A comparison of the composition and ranking of the leading poultry meat exporting countries in 2006 and 2016 reveals some interesting changes. The USA which contributed 30,8% to the global export volume in 2006 was replaced by Brazil in first rank. Both countries lost shares in the global exports despite the increase of their export volumes. Poland climbed from rank nine to rank five, Turkey replaced China. France was the only country with a decreasing export volume, mainly a result of the drastic reduction of turkey meat exports.
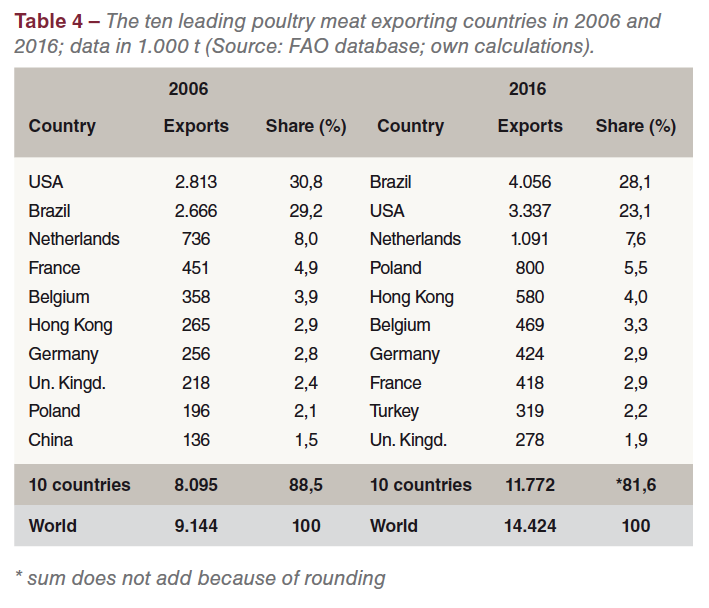
The global export volume grew by 5,28 mill. t in the analysed time period. Brazil contributed 1,24 mill. t or 23,5% to this increase, followed by the USA with 671.000 t (12,7%), Poland with 604.000 t (11,4%) and Turkey with 281.000 t (5,3%). The ranking of Hong Kong as a major poultry meat exporting country needs an additional explanation. As will be shown in Table 5, Hong Kong was also one of the leading importing countries. Of the imports, over 70% were re-exported, mainly to Taiwan and Viet Nam. The considerable growth of the export volumes in several EU member countries and Turkey resulted in a decrease of the shares of Brazil and the USA from together 60% in 2006 to 51,2% in 2016. On the other hand Poland gained 3,4%. As a result it can be stated that besides Brazil and the USA several EU member countries and Turkey were the main driving forces behind the considerable increase of poultry meat exports.
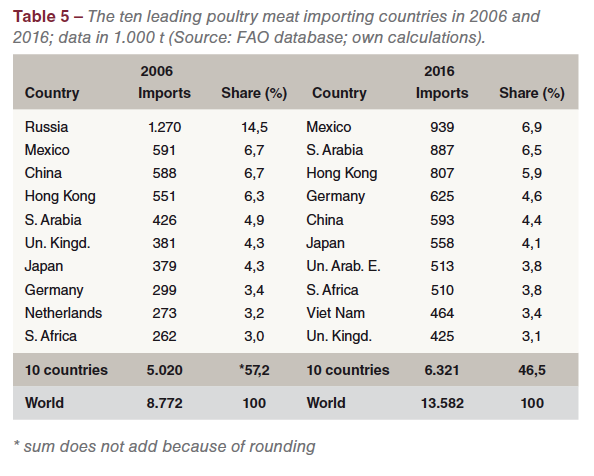 A comparison of Tables 4 and 5 shows that the regional concentration in poultry meat imports was much lower than in exports. This indicates that only a limited number of countries had a high production surplus over the domestic demand but that many more countries were not able to meet their demand by domestic production and therefore had to import poultry meat. A comparison of the composition and ranking of the ten leading countries in 2006 and 2016 reveals an interesting dynamics. In 2006, Russia ranked in first place with a share of 14,5%. Ten years later it was no longer to be found among the top ten importing countries. Within that decade Russia had expanded its broiler production considerably and almost reached full self-sufficiency. In addition, the import embargo in connection with the annexation of the Crimean Peninsula and the turmoil in Ukraine against the USA, Canada and EU member countries explains the change. Viet Nam replaced the Netherlands, the United Arab Emirates Russia; Saudi Arabia climbed from rank five to rank two; Germany from rank eight to rank four.
It is worth noting that the highest import growth occurred in Saudi Arabia with 461.000 t, followed by Viet Nam with 422.000 t, Mexico with 348.000 t and Germany with 326.000 t. These four countries together shared 32,4% of the global increase in poultry meat imports. It is obvious that the growing demands in several Western and Eastern Asian countries as well as in Mexico, South Africa and Germany was responsible for the considerable growth of poultry meat exports. Germany was one of the major poultry meat exporting and importing countries. A closer look at the traded goods would show that mainly high-value products (breast filets) were imported while low-value products (necks, wings, claws and upper shells) were exported.
Summary and perspectives
The preceding analysis could show that trade with poultry meat grew faster than production, indicating the increasing demand in many developing countries. The regional concentration in exports was much higher than in imports. In poultry meat exports, North America, Central and South America and Europe contributed 89,5% to the global export volume. In imports, Asia and Europe shared 70,8% in the import volume. Brazil and the USA, the two leading poultry meat exporting countries, together contributed 51,2% to the global exports. Poland and Turkey, newcomers among the leading countries, were able to increase their export volumes considerably. In poultry imports, no country was in a dominating position. Mexico and Saudi Arabia, the leading two countries, contributed only 13,4% to the global import volume.
It can be expected that in the coming decade the relative growth rate in poultry meat trade will be higher than in production. The increasing purchasing power of a growing middle-class in some threshold and developing countries will be the main steering factor behind the predicted dynamics.
Read the second article here.
Data source and additional literature
FAO database: http://www.fao.org/faostat.
Windhorst, H.-W.: The Globalisation of Egg and Poultry Meat Production. An Analysis on Country Development Group Level. London: International Egg Commission 2017. 35 p.
Windhorst, H.-W.: Brazil: considerable increase of broiler meat and egg production. Part 2: Trade. In: Zootecnica international 39 (2017), no. 9, p. 20-23.
Windhorst, H.-W.: The U. S. poultry industry in transition. In: Zootecnica International 39 (2017), no. 10, p. 18-21.
Windhorst, H.-W.: Dynamics and patterns in EU and USA egg and poultry meat production and trade. (= WING Beiträge zur Geflügelwirtschaft Heft 17). Vechta 2017. 76 p.
Windhorst, H.-W.: Patterns of EU poultry meat production and consumption. A 2016 status report. In: Zootecnica international 40 (2018), no. 1, p. 20-23.


