

The development of the egg exports by the EMC
The third and fourth part of the report will analyse the development of egg trade by the EMC between 2006 and 2016 and their role in global egg trade.
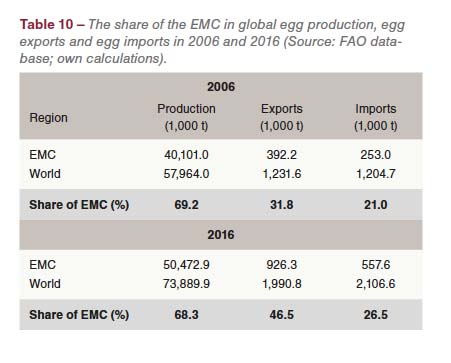
Between 2006 and 2016 egg exports and imports by the EMC grew much slower than production (Table 10). Nevertheless, the trade volumes increased considerably. Egg exports in 2016 were 534,100 t or 136.2% higher than in 2006, resulting in an increase of their share in the global export volume by 14.7%. Egg imports by the EMC grew by 304,600 t or 120.4%. Their shares in the global import volumes increased by 5.5%. The difference between the share in exports and imports in the global trade volume indicates that the EMC were not only able to meet the growing domestic demand in 2016 better than in 2006 but also that some countries generated a surplus which could be exported.
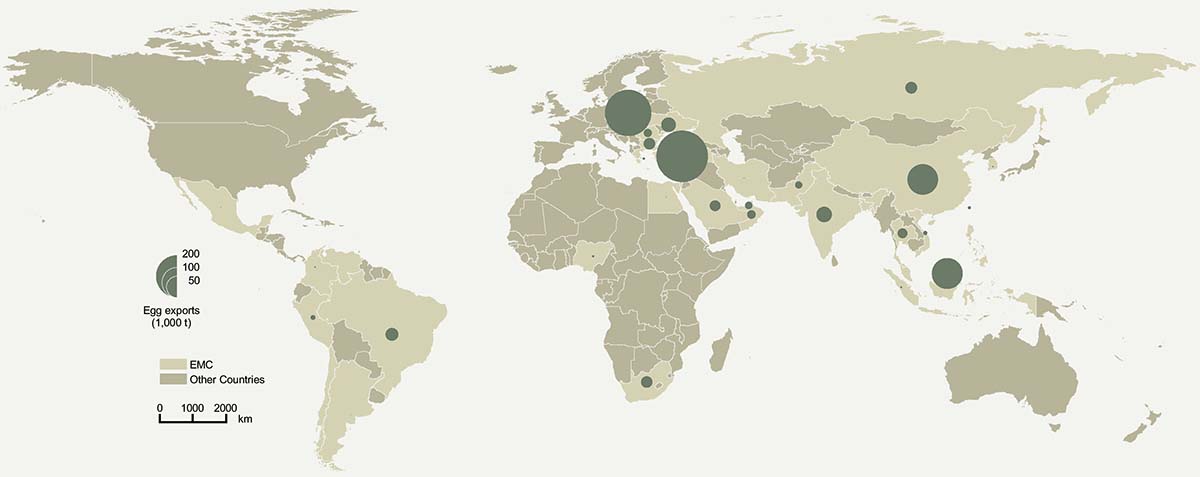
Figure 3 – Egg exports by Emerging Market Countries in 2016.
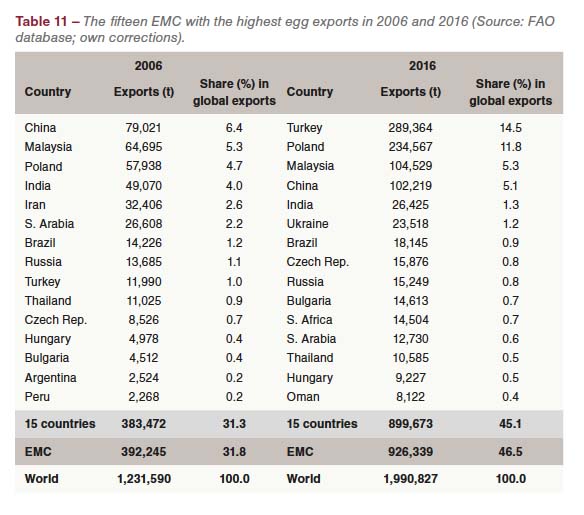
In Table 11, the fifteen leading EMC in egg exports in 2006 and 2016 are listed. A comparison of the composition and ranking in the two years reveals some remarkable changes. In 2006, the fifteen countries exported 383,472 t of eggs, which equaled 97.8% of the total export volume of the EMC. China, Malaysia, Poland and India ranked as number one to four, sharing together 20.4% of the global egg exports. In 2016, Turkey ranked as number one with an export volume of 289,364 t, 277,374 t more than in 2006. Poland surpassed Malaysia; China fell to rank four and India to rank 6. China lost 1.3% of its former share, India even 3.7%. A big step forward made Ukraine from 18th to 6th place, adding 1.1% to its former share in global egg exports. Besides India, which lost almost half of its former export volume, also Saudi Arabia and Thailand exported fewer eggs in 2016 than in 2006. The fast growing per capita consumption in India and Saudi Arabia explains the reduction; in Thailand several AI outbreaks were the main steering factor behind the decline of the export volume. The spatial pattern of egg exports by the EMC is documented in Figure 3.
The 37 EMC contributed 70.5% to the absolute increase of the global export volume, Turkey and Poland alone 59.8%. Both countries were the most important newcomers in global egg exports. The regional concentration in the egg exports of the EMC was very high in 2006 and also in 2016. In 2006, the 15 leading countries contributed 97.8% to the total export volume of the 37 countries, the other 22 countries only 2.2%. The situation was similar in 2016. The fifteen leading countries shared 97.1%, the other 22 only 2.9%.
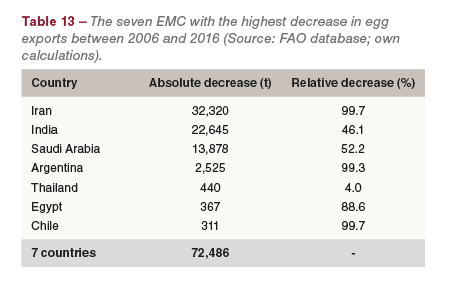
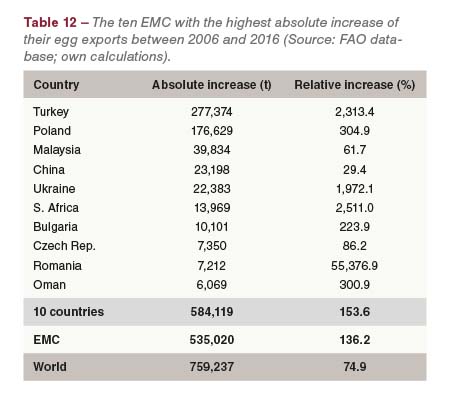
Table 12 lists the ten EMC with the highest absolute growth of their egg exports between 2006 and 2016. Their export volume was higher than that of the whole group, a result of declining exports in some EMC (see Table 13). Of the ten leading countries, five were located in Europe, four in Asia and one in Africa. This distribution reflects the dynamics in egg production. In several countries, the relative growth rates were extremely high because of their low export volumes in 2006. This was in particular the case in Romania, South Africa, Turkey and Ukraine. Because of the remarkable increase in egg production, Turkey ranked in second place behind the Netherlands at the global level among the leading egg exporting countries.
Several EMC reduced their egg exports in the analysed decade (Table 13). Iran, Argentina and Chile stopped exports almost completely; Egypt by 88.6%; India and Saudi Arabia halved their export volumes. The relative decline in Thailand was much lower and was mainly caused by the various AI outbreaks. In the other countries, demand grew faster than production so that the exports had to be reduced.
Read the first part here
Read the secondt part here


