
Part 1: The development of the laying hen inventories
Introduction
In four papers, the dynamics of egg production and egg trade in the Emerging Market Countries (EMC) will be analysed.
The term emerging market was first used in 1981 by Antoine Van Agtmael, a World Bank economist, to characterise a group of countries which were in a transformation phase from developing to developed countries. This term substituted a classification which was used in the 1970s, distinguishing between less developed countries and developed countries. Van Agtmael coined the term of emerging market countries. This should indicate that they were transforming their socio-economic systems to more market-oriented economies. The term should also stress the fact that these countries might become attractive trade partners for the old industrialised countries. In 2009, Vladimir Kvint published a book with the title “The Global Emerging Market: Strategic Management and Economics”. He analysed the factors which initialized the transformation process. In the following years, a great number of publications appeared which dealt with the classification of such countries and the parameters by which they could be characterised. It is obvious that there is no generally accepted list of countries which belong to the group of emerging markets. Julien Vercueil (2012) suggested that a more pragmatic term was emerging economies. Countries belonging to such a group could be characterised by:
- an intermediate income between 10% and 75% of the average EU per capita income,
- a fast economic growth over the past decade, which narrowed the income gap between less developed and developed economies,
- and institutional transformation processes which allowed a better integration into the world economy.
In this report, a list of 37 emerging market countries (EMC), based on classifications of the World Bank, the International Monetary Fund and the Food and Agricultural Organisation (FAO) will be used.[1] In 2017, they shared 68.2% of the global population, 68.1% of the world laying hen inventory and 73.4% of global egg production.
The status of the EMC in the global population and the Gross Domestic Product
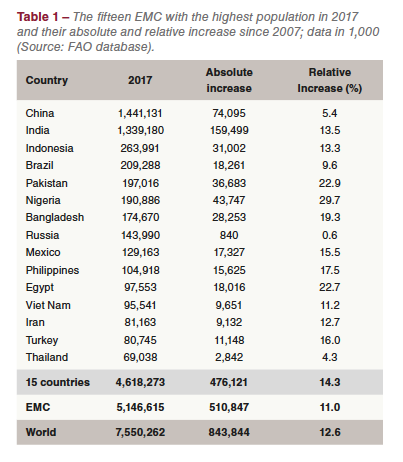
Between 2007 and 2017, the population in the 37 EMC increased from 4.58 billion to 5.09 billion people or by 11.1%. In the same decade, the global population grew by 12.6% or 837 mill. The EMC shared 56.4% in the global population growth.
The fifteen EMC with the highest population contributed 92.4% to the total growth of the EMC. The highest absolute increase showed India, China, Nigeria and Pakistan; the highest relative growth rate Nigeria, Pakistan, Egypt and the Philippines. The lowest relative increase was to be found in Russia, Thailand, China and Brazil.
The global GDP reached a volume 80,683.8 trillion US-$. To this, the 37 EMC contributed 29,587.9 trillion US-$ or 36.7%. Within the group, the values differed considerably. While China generated a GNP of 12,238 trillion US-$, sharing 15.2% of the global GDP, Nigeria only 375.8 mill. US-$ or a share 0.5% (Table 2).
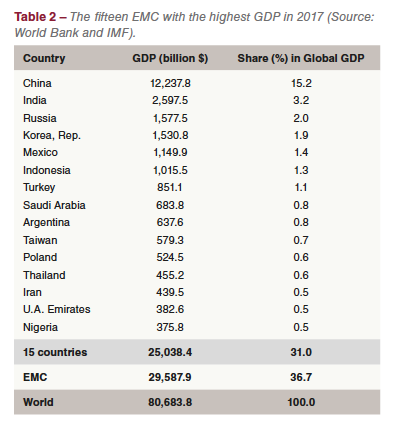
It is worth noting that the EMC shared 68.2 % in the global population but only 31.0 % in the global GDP. This documents the considerable difference in the economic strength of the individual countries and the wide gaps between them and the leading market economies.
The dynamics in the development of the laying hen inventories in the EMC
In Table 3, the development of the population, the laying hen inventories and egg production between 2007 and 2017 is compared to the global dynamics.
The laying hen inventories in the EMC grew by 1.21 billion birds or 38.1%. This resulted in an increase of the contribution to the global laying hen inventory by 3.5%. In contrast, the global inventories increased only by 32.1%.
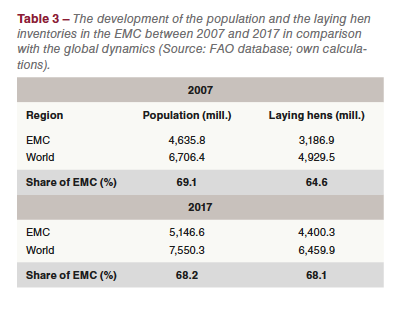
Table 4 shows a list of the fifteen EMC with the highest number of laying hens in 2007 and 2017. A closer analysis reveals some remarkable changes in the ranking of the countries. While India ranked in third place behind China and Brazil in 2007, it stepped up to second place in 2017. Indonesia fell from rank 4 to rank 7 while Bangladesh climbed from rank 8 to rank 4. Mexico and Russia were able to maintain their ranks while Pakistan, Turkey and Malaysia gained higher ranks in 2017 compared to 2007. Iran was replaced by Ukraine. The fifteen leading EMC gained 4.9% in their share in the global laying hen inventory, the 37 EMC 3.5%. This documents the faster growth of the laying hen flocks in the fifteen leading countries in comparison to the whole group.
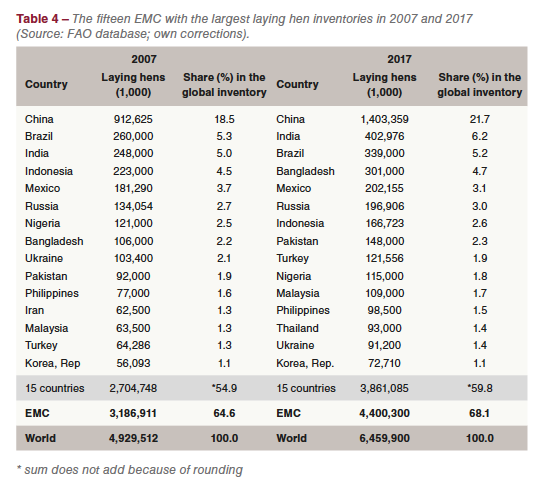
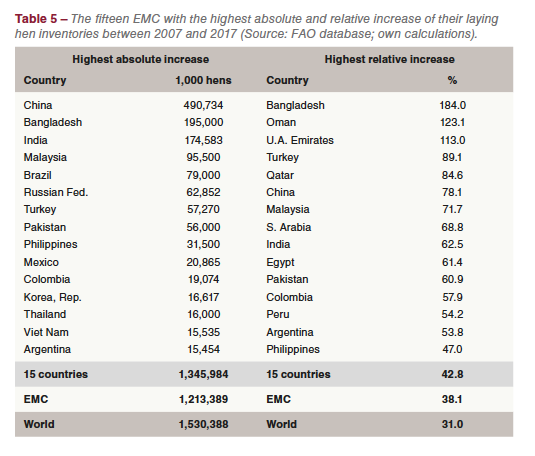
Table 5 lists the fifteen EMC with the highest absolute and relative growth of their laying hen inventories. The composition and ranking of the countries regarding the relative growth is not identical with that of the absolute increase as a comparison easily shows.
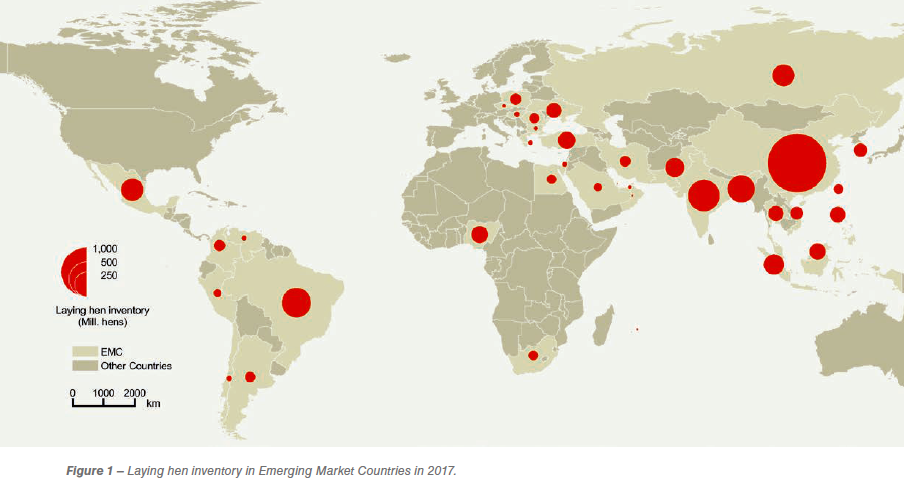
A closer look at the data reveals that the absolute growth of the laying hen inventory in the fifteen EMC was higher than that of the whole group. This documents that in several EMC the number of laying hens must have decreased. The relative growth rate in the fifteen EMC and in the whole group was much higher than at the global level. From this one can conclude that the EMC played a decisive role in the global dynamics of the laying hen inventories and in egg production. It is worth noting that ten of the fifteen EMC with the highest increase of their laying hen flocks were located in Asia. China, Bangladesh and India alone contributed 56.2% to the growth of the global laying hen inventory. Of the fifteen EMC with the highest relative growth of their laying hen flocks, eleven were located in Asia. This also documents the outstanding role of Asian EMC in the dynamics of the global egg industry. The spatial pattern of the laying hen inventories in the EMC in 2017 is documented in Figure 1.
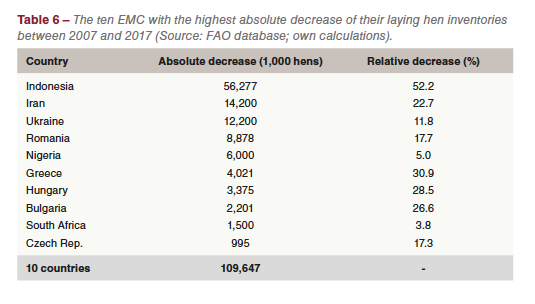
Not all EMC were able to increase their laying hen flocks in the analysed decade. Table 6 shows that the ten counties with a decline of their inventories together lost 109.6 mill. hens. Five of the ten countries were located in Eastern Europe and six were EU member countries. While the transformation from conventional cages to alternative housing systems from 2012 on in the EU was the main reason for the decline in these countries, political and economic problems were the main steering factors in Ukraine and Venezuela.
[1] In the maps, all 37 countries are documented, in the tables the 15 leading countries in each category. The member countries are: Argentina, Bangladesh, Brazil, Bulgaria, Chile, China, Colombia, Czech Rep., Egypt, Greece, Hungary, India, Indonesia, Iran, Israel, Korea, Rep., Malaysia, Mauritius, Mexico, Nigeria, Oman, Pakistan, Peru, Philippines, Poland, Qatar, Romania, Russia, South Africa, Saudi Arabia, Taiwan, Thailand, Turkey, UAE, Ukraine, Venezuela, Viet Nam.
Read the secondt part here


