
The global poultry industry has shown a remarkable dynamics over the past decades in egg as well as in meat production. In this paper will be analysed the development of chicken meat production in the 18 leading countries (CLC) between 2008 and 2018. The number of considered countries is consciously oriented towards the number of clubs in major sports leagues.
Pattern of global poultry meat production
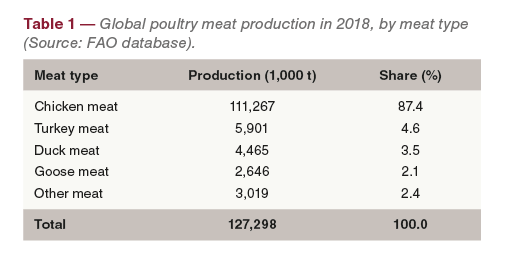
In 2018, 127.3 mill. t of poultry meat were produced worldwide, of this 111.3 mill. t or 87.4% was chicken meat (Table 1). Because of the dominating role of chicken meat, the analysis will focus on this meat type.
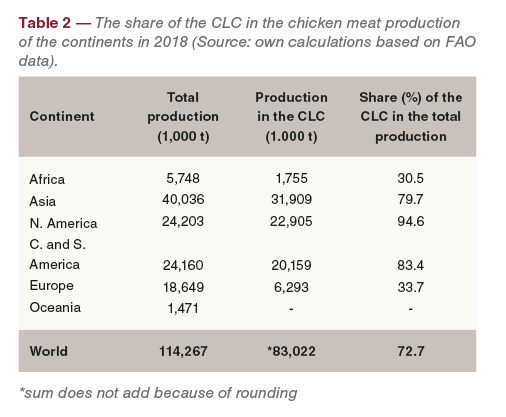
From the data in Table 2 one can see that the share of the CLC in the chicken meat production of the continents differed considerably. While they contributed 97.4% to the production volume in North America, it was only 30.5% in Africa and 33.7% in Europe. The contribution was also very high in Central and South America and in Asia. The detailed analysis at country level will be able to document the degree of the regional concentration.
Remarkable dynamics in chicken slaughter
In 2018, 4.4 billion people or 57.1% of the global population lived in the 18 CLC with the highest number of chicken slaughter. Of these countries, eleven were located in Asia, three in the Americas, three in Europe and one in Africa.
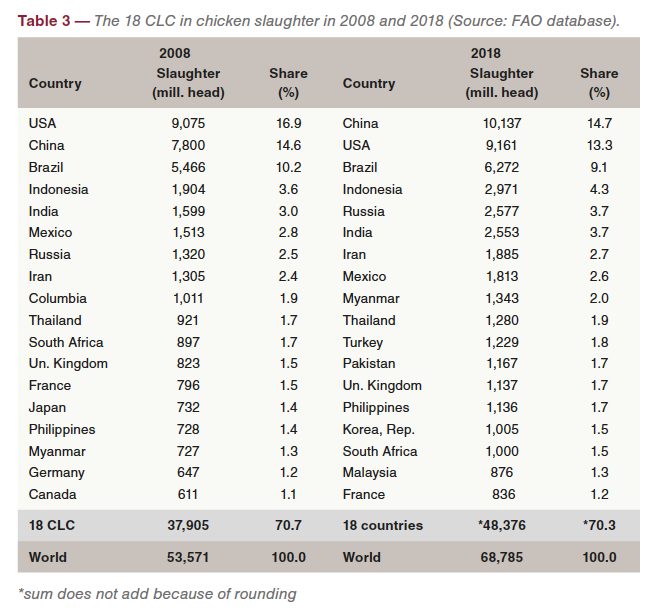
Between 2008 and 2018, global chicken slaughter increased from 53.6 mill. to 68.8 billion head or by 28.4%. In the CLC it grew from 37.9 to 48.4 billion head or 27.6% (Table 3). The lower relative growth rate in the group of the CLC indicates a fast growth also in other countries.
To the absolute increase of chicken slaughter by 10.5 billion head, China contributed 2.3 billion head or 22.3%, Russia 1.3 billion (12.0%), Indonesia 1.1 billion (10.3%), India 954 mill. (9.1%) and Brazil 806 mill. (7.7%). Together, the five countries shared 61.4% in the growth of the CLC and 42.3% in the global increase. It is worth noting that in the USA the number of slaughtered chickens grew by only 75 million head or 0.9%. The low rate is a result of continuously increasing slaughter weights of the broilers. The highest relative growth showed Pakistan with 125.3%, followed by Turkey (98.9%), Russia (95.2%) and Myanmar (84.7%).
A comparison of the composition and ranking of the countries reveals some remarkable changes. In 2018, Japan, Germany, Canada, and Columbia were no longer members of the 18 CLC. Turkey, Pakistan, the Republic of Korea and Malaysia replaced the four countries. The USA lost its top position to China. Russia surpassed India, Iran and Mexico. Myanmar climbed from rank 16 to rank 9. An even wider jump made Turkey from 20th to 11th rank. South Africa remained in the list of the 18 CLC but lost five ranks.
Extraordinary dynamics in chicken meat production
As the composition of the 18 CLC in chicken meat production differed from that in slaughter, the population also changed. In 2018, 4.6 billion people lived in the 18 CLC, sharing 58.8% in the global population. Nine of the 18 CLC were located in Asia, six in the Americas, two in Europe and one in Africa.
Between 2008 and 2018, chicken meat production increased by 33.4 mill. t or 41.3%, in the 18 CLC by 23.9 mill. t or 40.5% (Table 4). Similar to chicken slaughter, the relative global growth in chicken meat production was higher than in the CLC, resulting in a decrease of the regional concentration from 73.1% to 72.7%. Obviously, production in other than the CLC was also very dynamical. Of all animal products, chicken meat production grew fastest (see Windhorst 2019). The lack of religious barriers, the strong position in fast food restaurants and the excellent feed conversion were the main steering factors behind the success story of this meat type.
In 2018, the six CLC located in America shared 51.9% in the overall production of the CLC, the nine Asian countries 38.4%, the two European countries 7.6%, and South Africa, the only African country in the group, 2.1%.
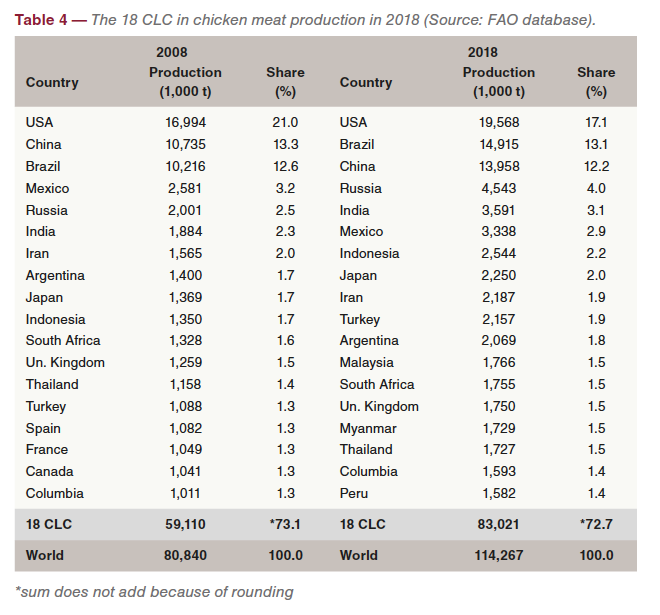
To the absolute increase of the chicken meat production in the 18 CLC by 23.9 mill. t, Brazil contributed 4.7 mill. t (19.7%), China 3.2 mill. t (13.5%), the USA 2.6 mill. t (10.8%) and Russia also about 2.6 mill. t (10.6%). It is worth noting that Brazil and China shared almost exactly one third in the production growth. The highest relative increase showed Russia (127.0%), Myanmar (120.3%), Turkey (98.3%) and India (90.6%). While Turkey produced more than the domestic demand and exported chicken meat, the growth in the other countries was mainly a result of the increasing domestic demand. The extraordinary dynamics in Myanmar, it had a parallel in egg production, was caused by investments of the Thai CP group. The company installed vertically integrated companies according to systems in Thailand. Russia expanded its chicken meat production very fas to compensate the decrease in pig meat which resulted from the outbreaks of African Swine Fever.
A comparison of the composition and ranking of the leading countries in 2008 and 2018 shows some interesting changes. In 2018, Spain, France and Canada were no longer members of the top group. They were replaced by Malaysia, Myanmar and Peru. The USA was able to defend its first rank but lost 3.9% of its former share. Brazil surpassed China and could increase its contribution to global chicken meat production by 0.5% while China lost 1.1%. Russia surpassed India and Mexico and gained 1.5%. India was also one of the winners with an increase of 0.8%; on the other hand, Mexico lost 0.3%. A wide jump made Malaysia from 19th rank in 2008 to 11th rank ten years later.
Slaughter weights differed considerably
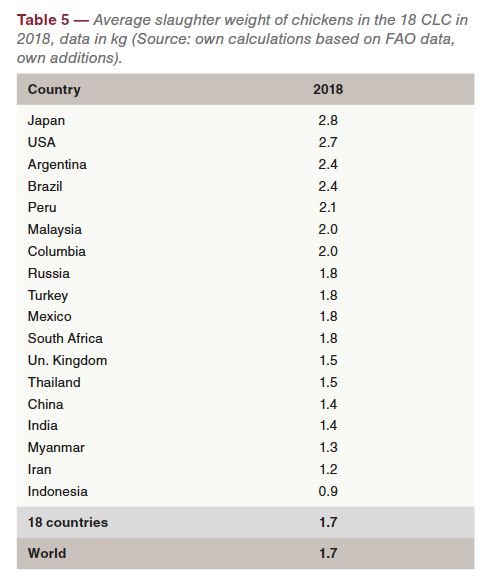
A comparison of the development of the average slaughter weights of chickens between 2008 and 2018 shows that they increased from 1.51 kg to 1.60 kg, in the 18 CLC from 1.55 kg to 1.71 kg. A trend towards higher birds is obvious. Table 5 shows considerable differences between the countries. Higher slaughter weights document the consumer preference of cut up parts over whole birds (Japan, USA, Brazil). Lower slaughter weights resulted from the preference of whole birds in meals but also from slow growing local breeds in less developed countries (India, Indonesia, Myanmar, Thailand).
Summary
The dynamics in global chicken meat production between 2008 and 2018 was reflected in the development in the 18 CLC. The relative growth of the production volume in these countries reached 40.5%, only 27.6% in contrast in chicken slaughter. This indicates a trend towards higher average slaughter weights and the increasing preference of the consumers of cut up parts over whole birds. This is not the case, however, in several less developed countries. The main winners in the documented dynamics in chicken meat production were Brazil, Russia, Turkey, India and Indonesia. The USA and China could also increase their production, but they, nevertheless, lost shares in the global production.
Data source and suggestions for further reading
FAO database: www.faostat.org.
Windhorst, H.-W.: Globale Dynamik von Geflügel. Weltweite Analyse der Jahre2006 bis 2016 in der Geflügelfleischerzeugung. In Fleischwirtschaft 99 (2019), Nr. 2, S. 30-32.
Windhorst, H.-W.: Die Zeichen stehen auf Wachstum. Analyse des Handels der vier wichtigsten Geflügelfleischarten im Jahr 2017. In: Fleischwirtschaft 100 (2020), Nr. 3, S. 21-24.


