
Modern technology is increasingly being used on breeder farms, creating increases in data generation. This data can be analyzed by the farmer to make smarter decisions to improve flock performance and efficiency.
As genetics improve yearly, so will efficiencies and production performance. But are improvements in line with expectations? And how does an operation compare itself to top-performing operations? Comprehensive data collection provides opportunities to predict future performance, supply chain demands, and future results. If the expected outcome is not achieved, then datasets are available to understand the issues.
Many breeder farmers are only using paper records and little electronic data. Conversely, some operations generate so much data that it becomes messy. Some data are unreliable due to staff completing tasks hastily such as weighing while also collecting eggs. Good data collection is important since many critical decisions, including feed allocations, are based on reliable bodyweight data.
Technology will never replace stockman skills needed for successful flock management. There are many missed opportunities where farmers/workers have missed vital and negative behavioral signs that affect flock performance.
Many consultants offer data analysis services but do not have the experience of stockman skills and breeder management. Interpretation of the data requires local knowledge such as seasonal effects or knowledge of breed-specific behavioral traits. For example, a consultant could state that heavy hens produce fewer chicks. However, the relationship is multifactorial because as hens age, they become heavier and egg production declines. Moreover, chick production is a function of both fertility and hatch of fertile (incubation). Furthermore, fertility is most often attributed to male management, but it is female-related on rare occasions.
Objectivity and experience are important when interpreting suboptimal performance data using regression graphs. Comparing performance of a farm to industry standards is a basic first step when analyzing data. It only shows how the farm compares to the industry. Data that can help to improve flock productivity and profitability is key, and with roosters, it is reflected in weight, condition, feed intake, and fertility.
In the production of hatching eggs or chicks, reproductive performance is always the main driver. The old adage, “If you can measure, it you can manage it” is very true, but how do you measure a certain biological event that cannot be measured or weighed? First, find a way to quantify it, then work out the measurements, and finally collect the data. For example, how do you know if the males are getting enough feed? How do you know the cause of low early hatchability or poor peak percentage of hatchability? This is where stockman skills are very important because the measurements are subjective but need to be quantified to produce data.
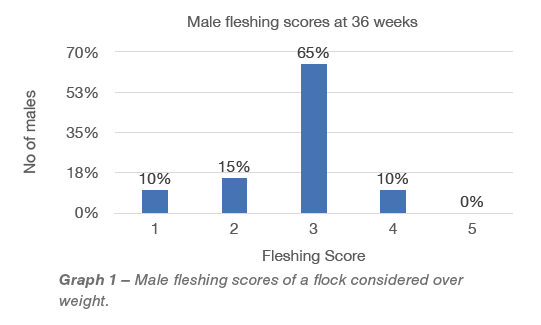
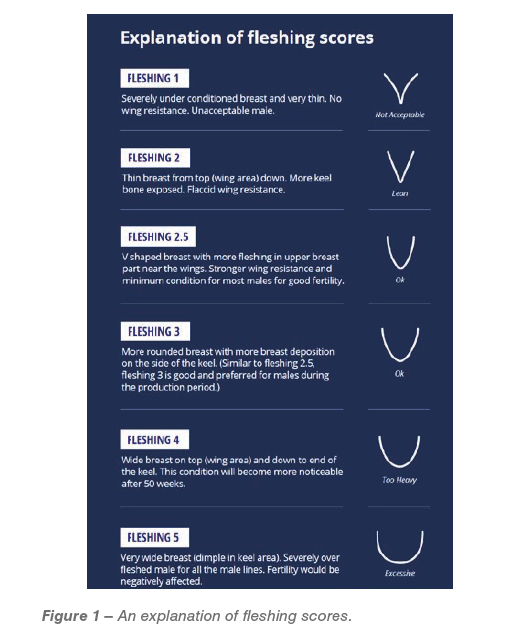
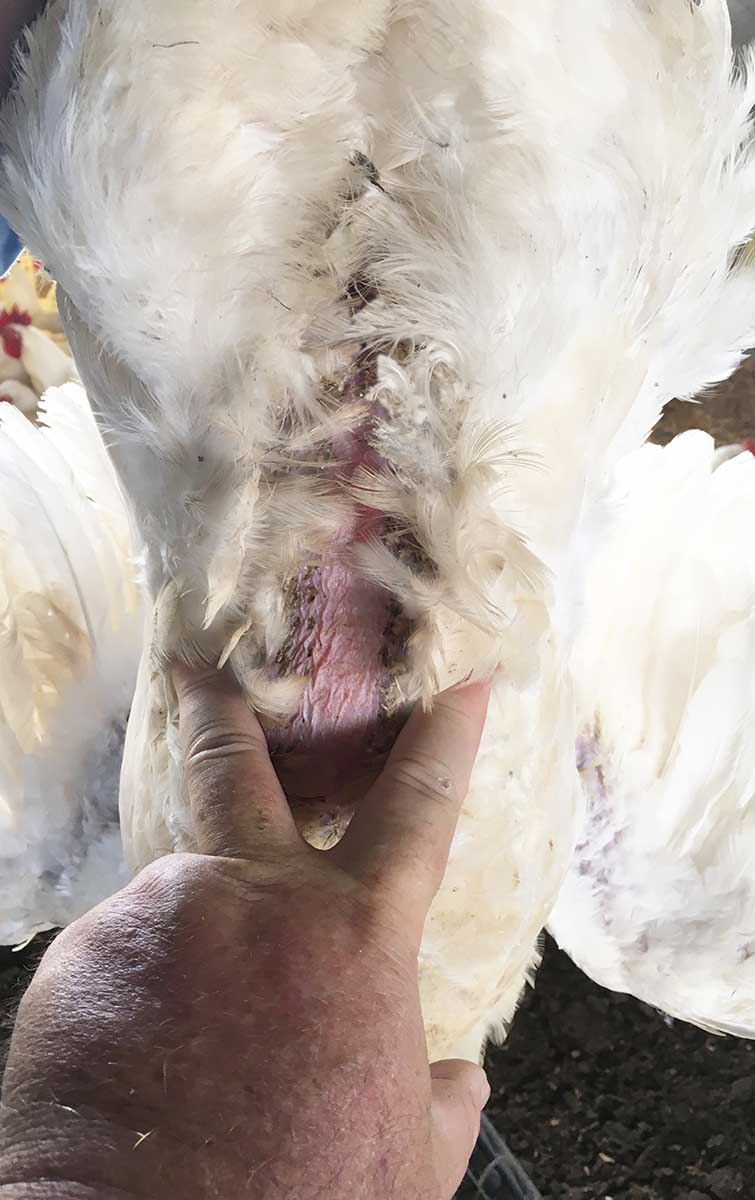
In the field case below, the breeder males were over weight and fertility was declining. The production graph indicated the males were heavy and considerably above their weight for target age. At the farm, the condition of the males was quantified based on a breast muscle scoring system (Graph 1). The male breast scores are explained in Figure 1.
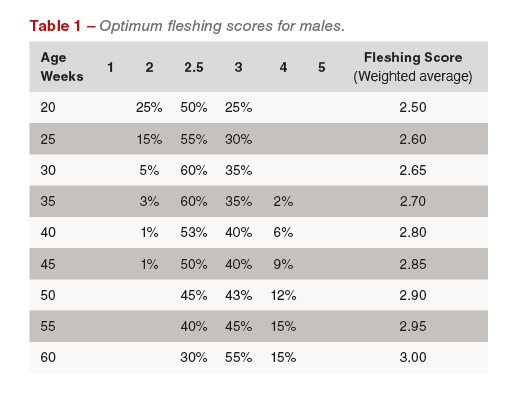
In Graph 1, 65% of the males had the desired fleshing score of 3, while 15% of the males were too thin and 10% were emaciated. Only 10% were well developed with a fleshing score of 4, leaving no males with fleshing scores of 5, which would be deemed over weight and unfit for reproduction. This means that 75% of the males were in good reproductive fitness condition, indicating they were not overfed. The remaining 25% were off target for 36 weeks of age, indicating that they may not be receiving enough feed, although they appeared “over weight.” Based on the bodyweight data alone, it appears the males were underfed to control the weight. This demonstrates the difference between weight and size the farmer experienced. Therefore, we increased the feed and fertility began improving. Table 1 shows the fleshing target table based on ages.
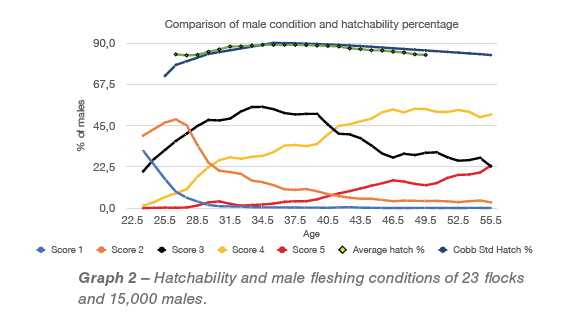
In another case study of declining hatchability, the farmer collected and kept weekly breast scoring records for each house. There were 23 houses totaling 15,000 males represented in the data (Graph 2). Graph 2 indicated that the males develop rather fast in their fleshing scores from 23 to 35 weeks of age. The scores 3 and 4 increased too rapidly. The thinner males with scores 1 and 2 were well managed since their numbers declined and remained a small portion of the population. This would indicate that these males were removed. The remaining males with a score of 3 reached a point at 35 to 40 weeks where they rapidly increased fleshing scores of 4 and 5, with a corresponding decline in score 3 males. This is the result of early and rapid increases in feed allocation through 32 weeks. Ideally, 70% of males should score 3 as long as possible for optimal fertility.
In Graph 2, hatchability data was graphed with the fleshing scores. It is interesting to note that the decline in hatchability began around the same time as the decline in score 3 and corresponding increases in scores 4 and 5. This indicated that the males became too heavy to continue mating, and over time the hatchability declined as the males developed bigger breast muscles. Using the data, it was ascertained that males were overfed in early production (23 to 32 weeks). Therefore, future feed intakes can be adjusted to control early muscle development and improve the hatchability through conditioning males after 40 weeks.
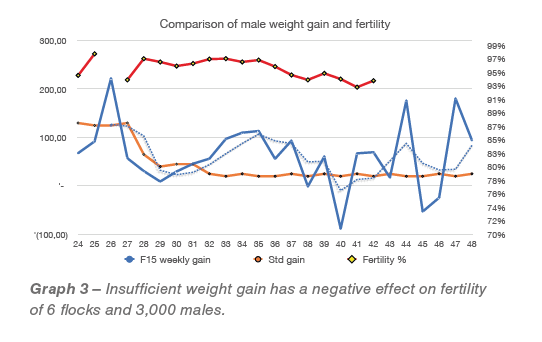
Another important key performance indicator of males is their weekly weight gain. After 32 weeks, they should gain very little weight (20 g to 25 g per week), and even large males should continue to grow. In Graph 3, the males had good weekly weight gains after 30 weeks for a few weeks, and at around 35 weeks, the weight gains ceased abruptly. At that point, they started losing conditioning, so much so that by 40 weeks, they were losing weight. The decline in growth or weekly gains after week 36 had a direct impact on the percentage of fertility, which dropped by 4%.
As seen in these examples, it is important to record measurable performance data. When there is a sudden change in production, the data can be used to identify the cause and prevent it from recurring in future flocks.
