

In three previous articles (Windhorst, 2026a, 2026b, 2026c) the role of the G20 countries in global meat production and trade on a continental and country basis was analysed. It became obvious that, between 2010 and 2024, meat trade grew much faster than production. This reflected the growing demand for meat. It was also noteworthy that the volume of imports by the G191 countries was smaller than the volume of exports, indicating that some member countries had a production surplus over the domestic demand, while others had to import meat to ensure the supply of meat to their populations. This concluding article examines the meat trade between G19 member countries. It also explores what share of the total trade volume was accounted for by trade between member countries, and the significance of non-member countries as export destinations or import sources.
One tenth of production was traded
Comparing meat production in the G19 group with trade volumes shows that approximately one tenth of production reached the global market. This indicates that production focused on supplying the domestic population. However, this does not mean that exports and imports were of minor economic significance. A comparison of the data in Table 1 for 2024 reveals considerable differences between meat types. Poultry meat occupied an exceptional position in terms of both production and export volume. Regarding imports, the quantities traded for the three meat types were closer together and the G19 countries imported almost identical quantities of pork and poultry meat. Notably, beef accounted for a significantly higher proportion of imports than of production and exports.

Source: FAO data.
Considerable differences in meat exports by types and country
A first step of the analysis examines the share of exports by selected G19 countries, broken down by meat type. This will be followed by an examination of the export distribution among G19 and non-member countries.
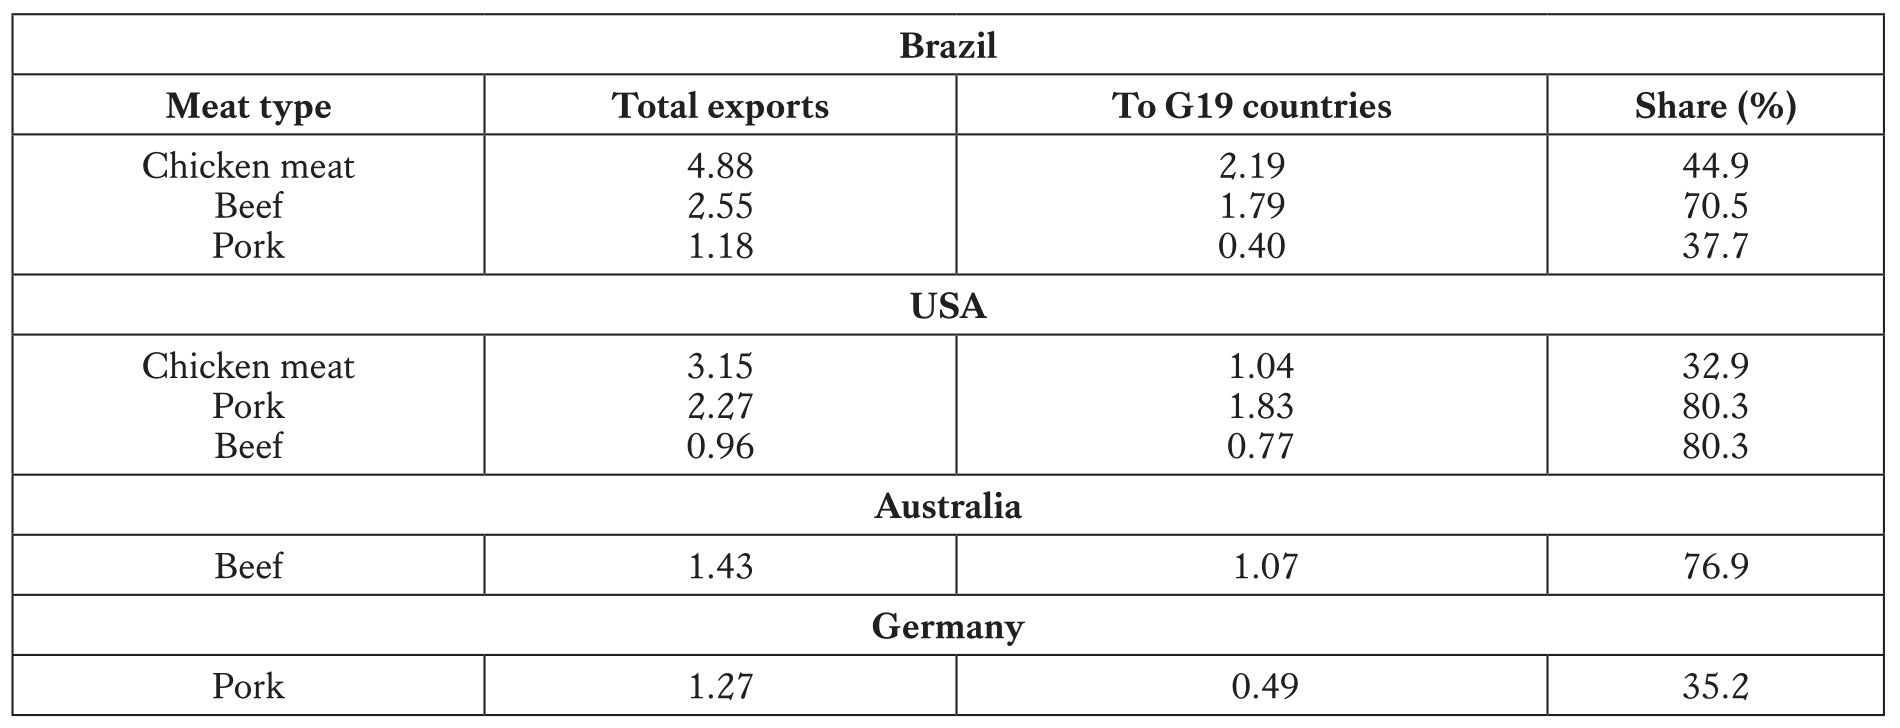
As can be seen from Table 2, Brazil exported a total of 8.6 million tonnes of meat, the USA 6.4 million tonnes. Together, these two countries accounted for 56.6% of the G19 group’s total exports. Including Germany’s pork exports and Australia’s beef exports, these four countries accounted for over two-thirds of the total export volume.
Source: FAO data.
Brazil and the USA dominated the G19 group’s chicken meat exports2 with 8 million tonnes, corresponding to 62.1% of total exports. The two countries accounted for 40.2% of pork exports and 69.7% of beef exports. Including Australia, the share of beef exports rose to 98.6%. Of the total G19 meat exports, these four countries exported 9.6 million tonnes, or 36.2%, to G19 member countries, meaning that around two-thirds were directed to non-member countries.
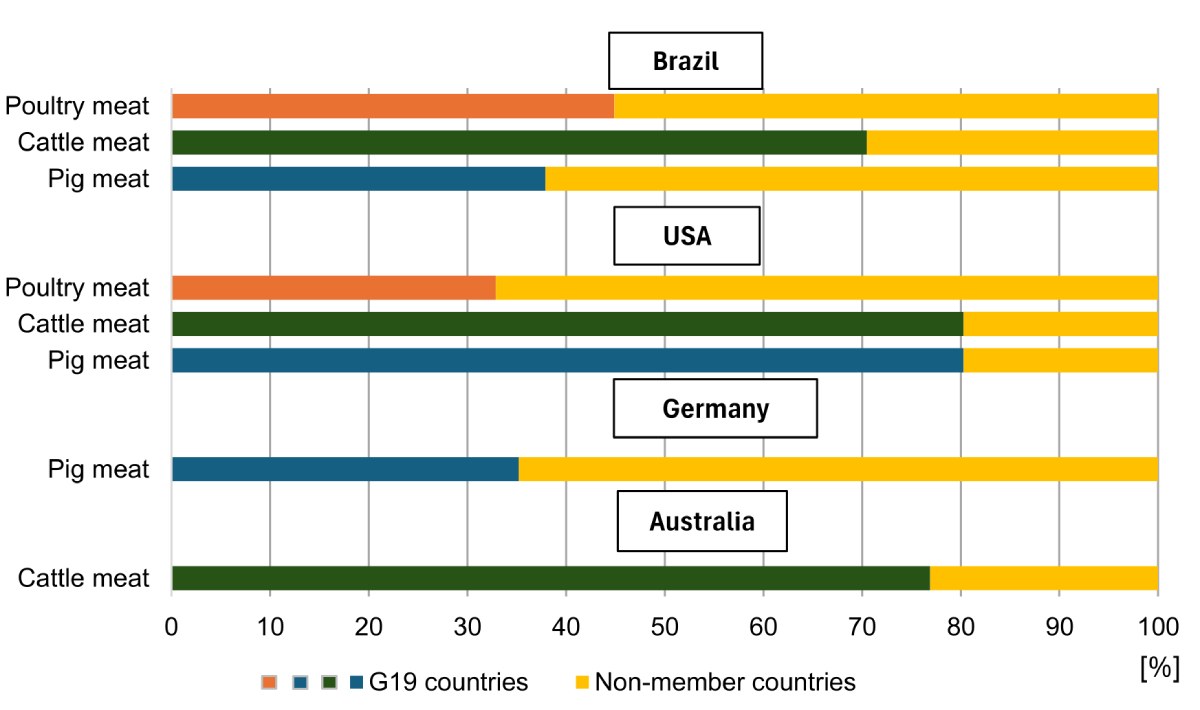
Figure 1 shows that there were significant differences in the share of exports to other G19 countries between the exporting countries and the three types of meat. The highest export volumes to G19 member countries were recorded in Brazil for beef, the USA for pork and beef, and Australia for beef. In contrast, Brazil exported chicken and pork predominantly to non-member countries, as did the USA. Germany exported two-thirds of its pork to non-member countries, primarily within the EU.
Design: A. S. Kauer, based on author’s calculations and FAO data.
Brazil and the USA were leading export countries
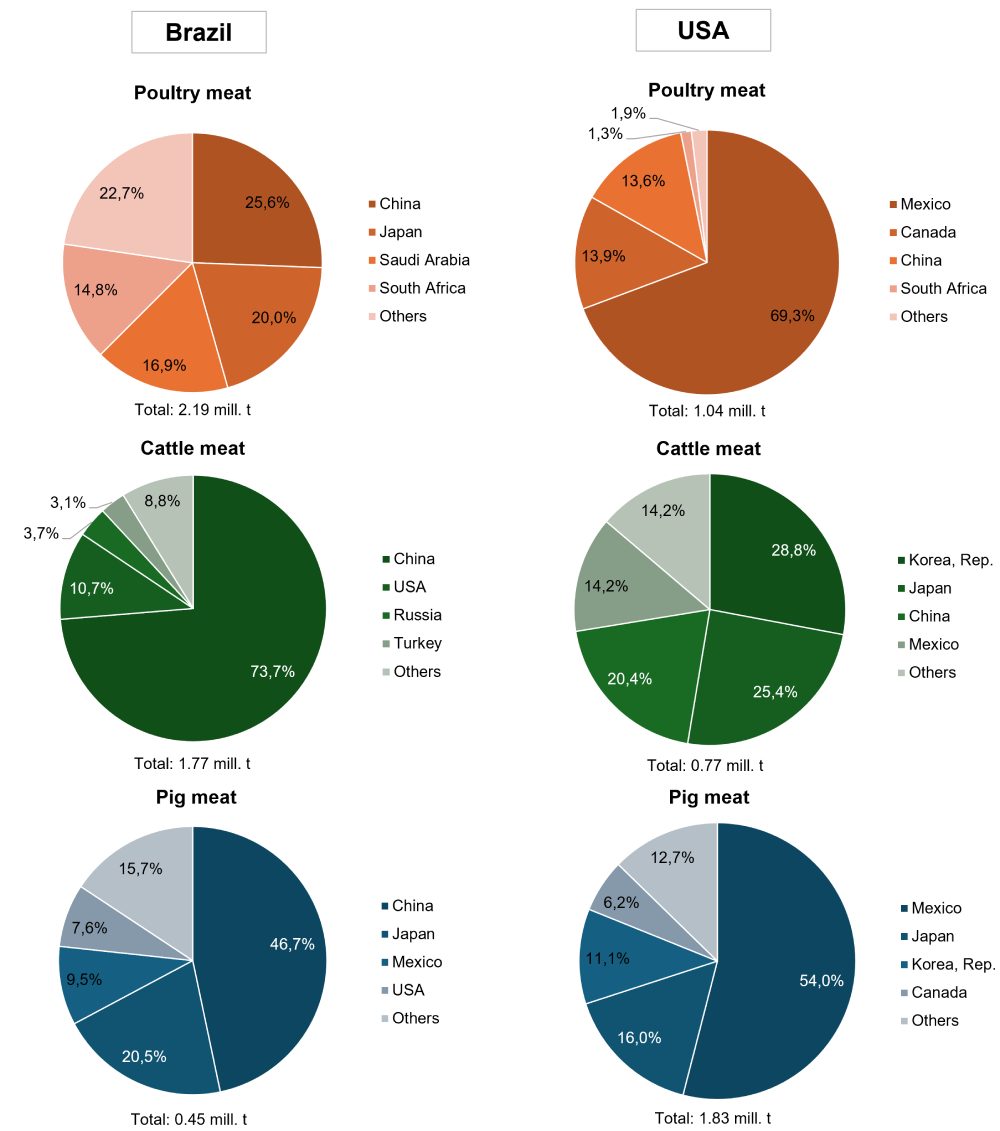
Figure 2 shows the four most important destination countries for each type of meat. Clearly, China, Japan, the USA and Mexico were the most important markets for Brazil. While sales volumes of chicken meat were more evenly distributed, 73.7% of beef exports went to China and 67.2% of pork exports to China and Japan.
Design: A. S. Kauer, based on FAO data.
The situation for the United States differed significantly from that of Brazil. A closer analysis of the data shows that Mexico’s and Canada’s participation in the USMCA free trade agreement significantly impacted market relations; 83.2% of chicken meat, 60.2% of pork and 14.2% of beef were exported to the two partner countries. Japan, China and the Republic of Korea were also important destination countries. These countries accounted for 74.6% of beef exports, 27.1% of pork exports and 13.6% of chicken meat exports.
They were also the most important markets for Australian beef exports, accounting for a combined share of 61.5%. Just over a third of exports went to the USA. Germany exported pork to the three other European G19 member countries and to the Republic of Korea. However, non-member countries were far more important, accounting for almost two-thirds of exports.
In summary, it can be stated that meat exports from the G19 countries accounted for around one tenth of the group’s total meat production. The leading exporters were Brazil and the USA, which together contributed over 56% to the total export volume. The distribution of exports among member countries of the group and non-member countries varied greatly, depending on the exporting country and type of meat. The most important destinations were East Asian countries on the one hand and member countries of the USMCA free trade zone on the other.
Large differences in imports by meat type and country
In the next step of the analysis, selected countries will be used to examine the proportion of imports from other G19 countries, broken down by meat type. This will be followed by an examination of the distribution among G19 countries and non-member countries.
As can be seen from Table 1, the G19 countries imported a total of 25.1 million tonnes of meat. Of this, pork and poultry meat accounted for almost equal amounts, with a combined total of 17.6 million tonnes corresponding to 70.0%, while beef accounted for 7.5 million tonnes or 30.0%.
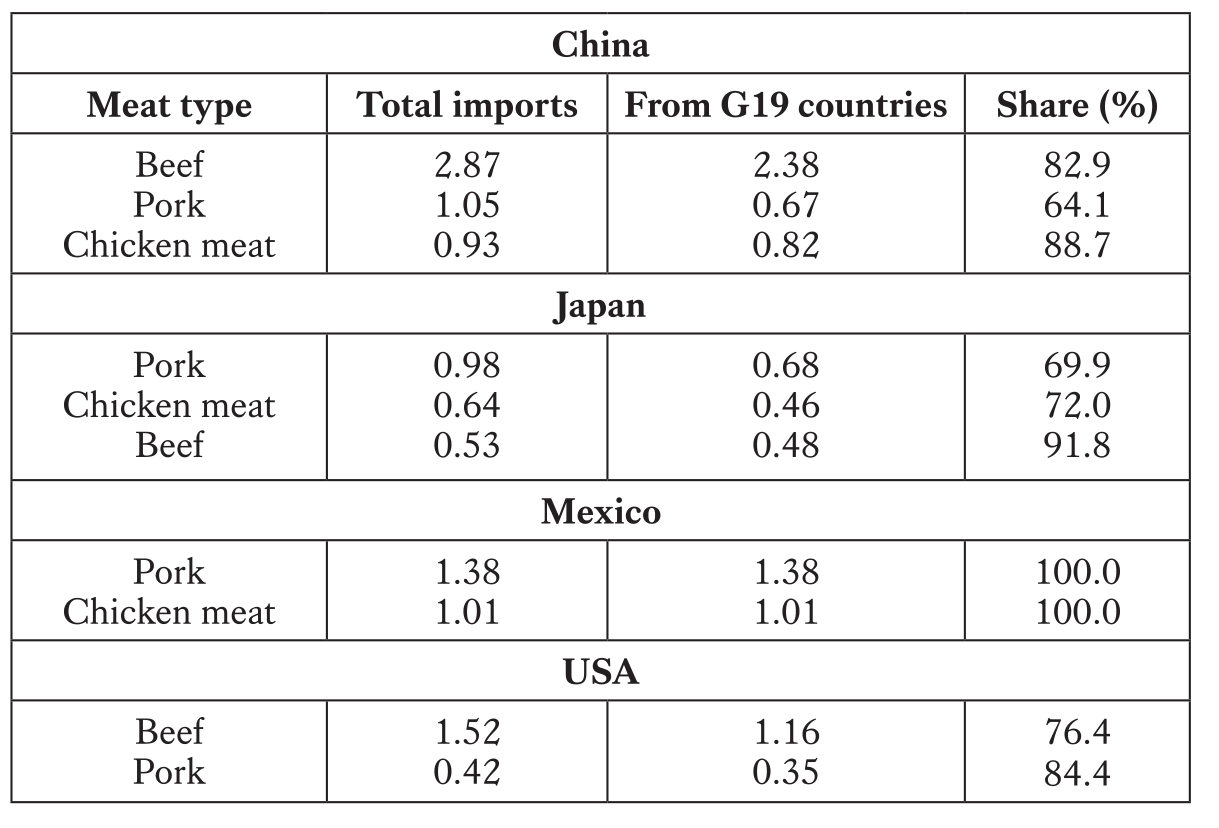
Table 3 shows that China imported a total of 4.8 million tonnes of meat, Mexico 2.4 million tonnes, Japan 2.1 million tonnes and the USA 1.9 million tonnes. Together, these four countries imported 11.4 million tonnes of meat, corresponding to 45.2% of the total imports of the country group. Although China imported the most meat by far, its 19.3% share did not make it as dominant as Brazil and the USA in exports. Clearly, the G19 group’s meat imports were spread across a larger number of countries than the exports, which were significantly more concentrated.
Source: FAO data.
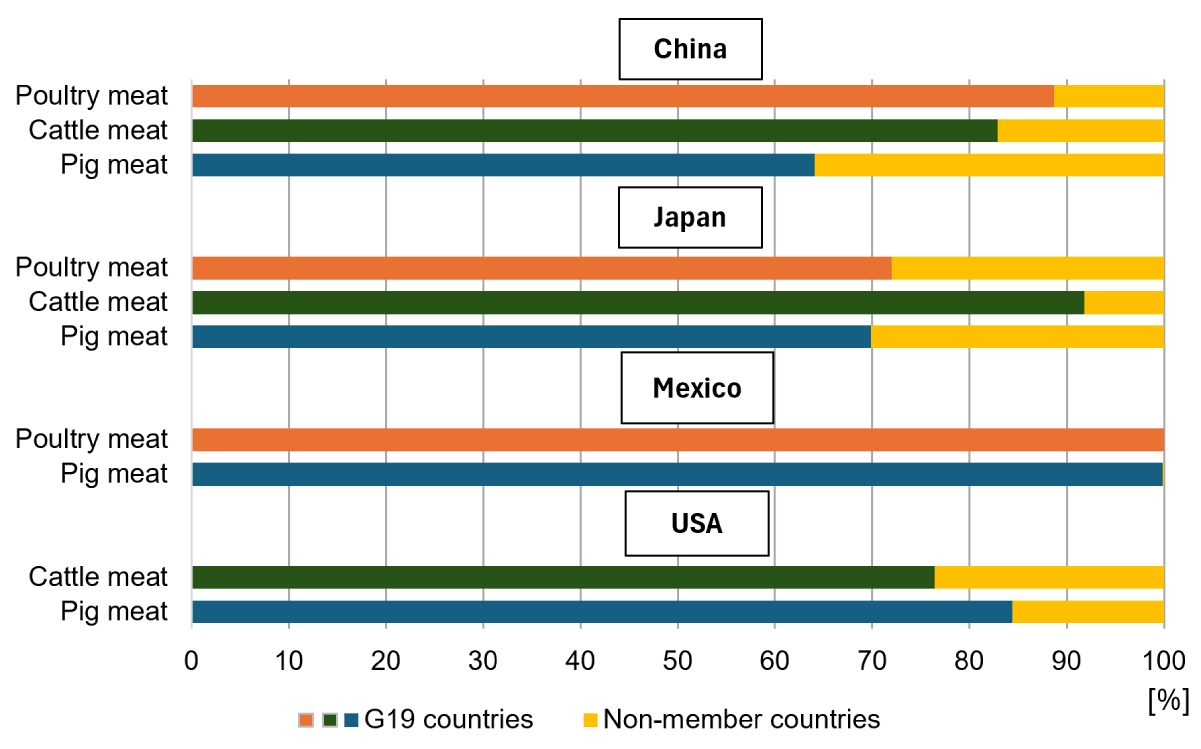
A total of 9.4 million tonnes of meat was imported by the G19 countries from other member countries. Of this, 4.0 million tonnes was beef, accounting for the highest share at 42.8%. This was followed by pork with 3.1 million tonnes (32.9%) and chicken meat with 2.3 million tonnes (24.3%). It is noteworthy that all four countries (China, Japan, Mexico and USA) sourced the vast majority of their imports from other member countries. Mexico imported pork and chicken exclusively from the two partner countries in the USMCA free trade agreement; obviously, tariff advantages were decisive in this case (Figure 3).
Design: A. S. Kauer, based on author’s calculations and FAO data.
China, Mexico and Japan were leading in meat imports
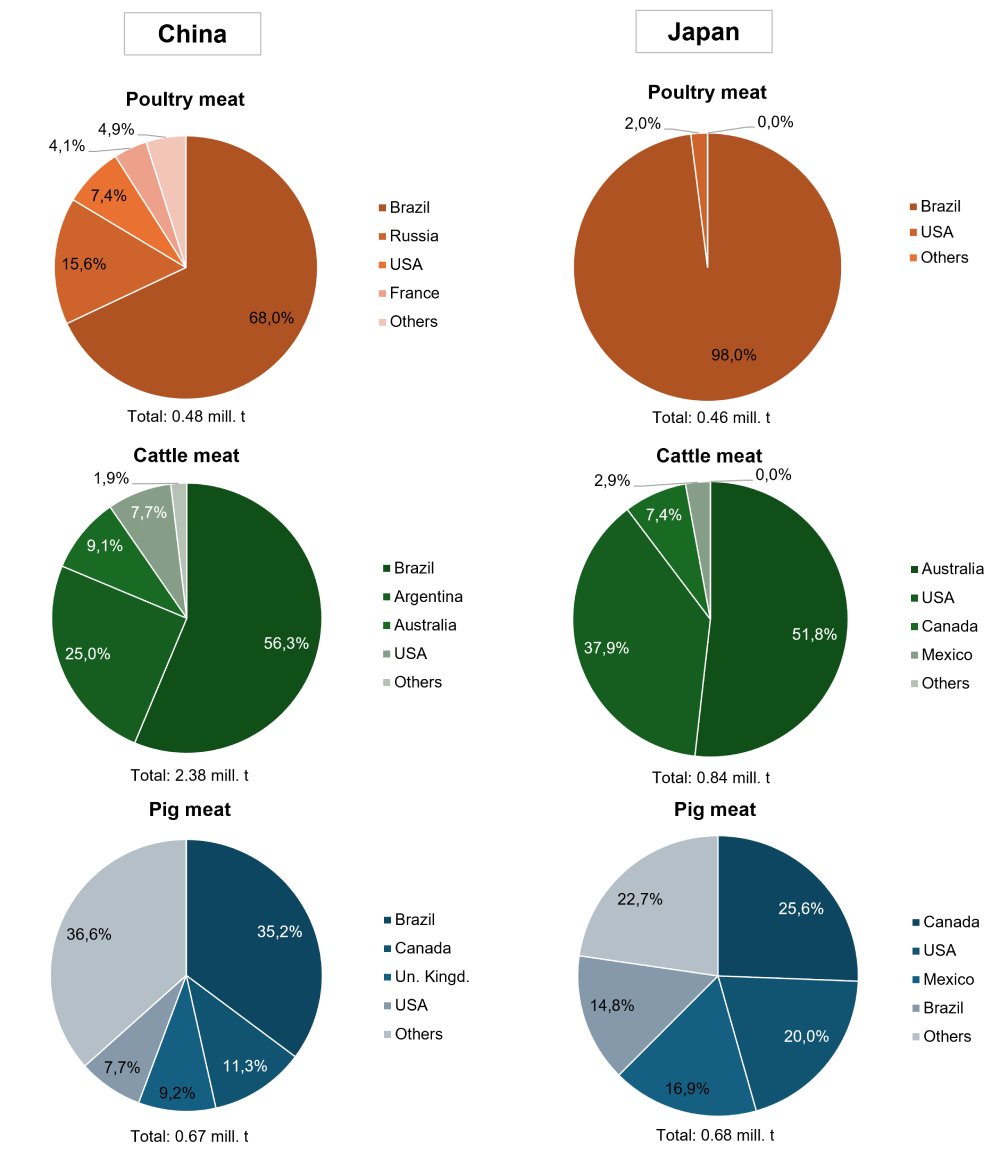
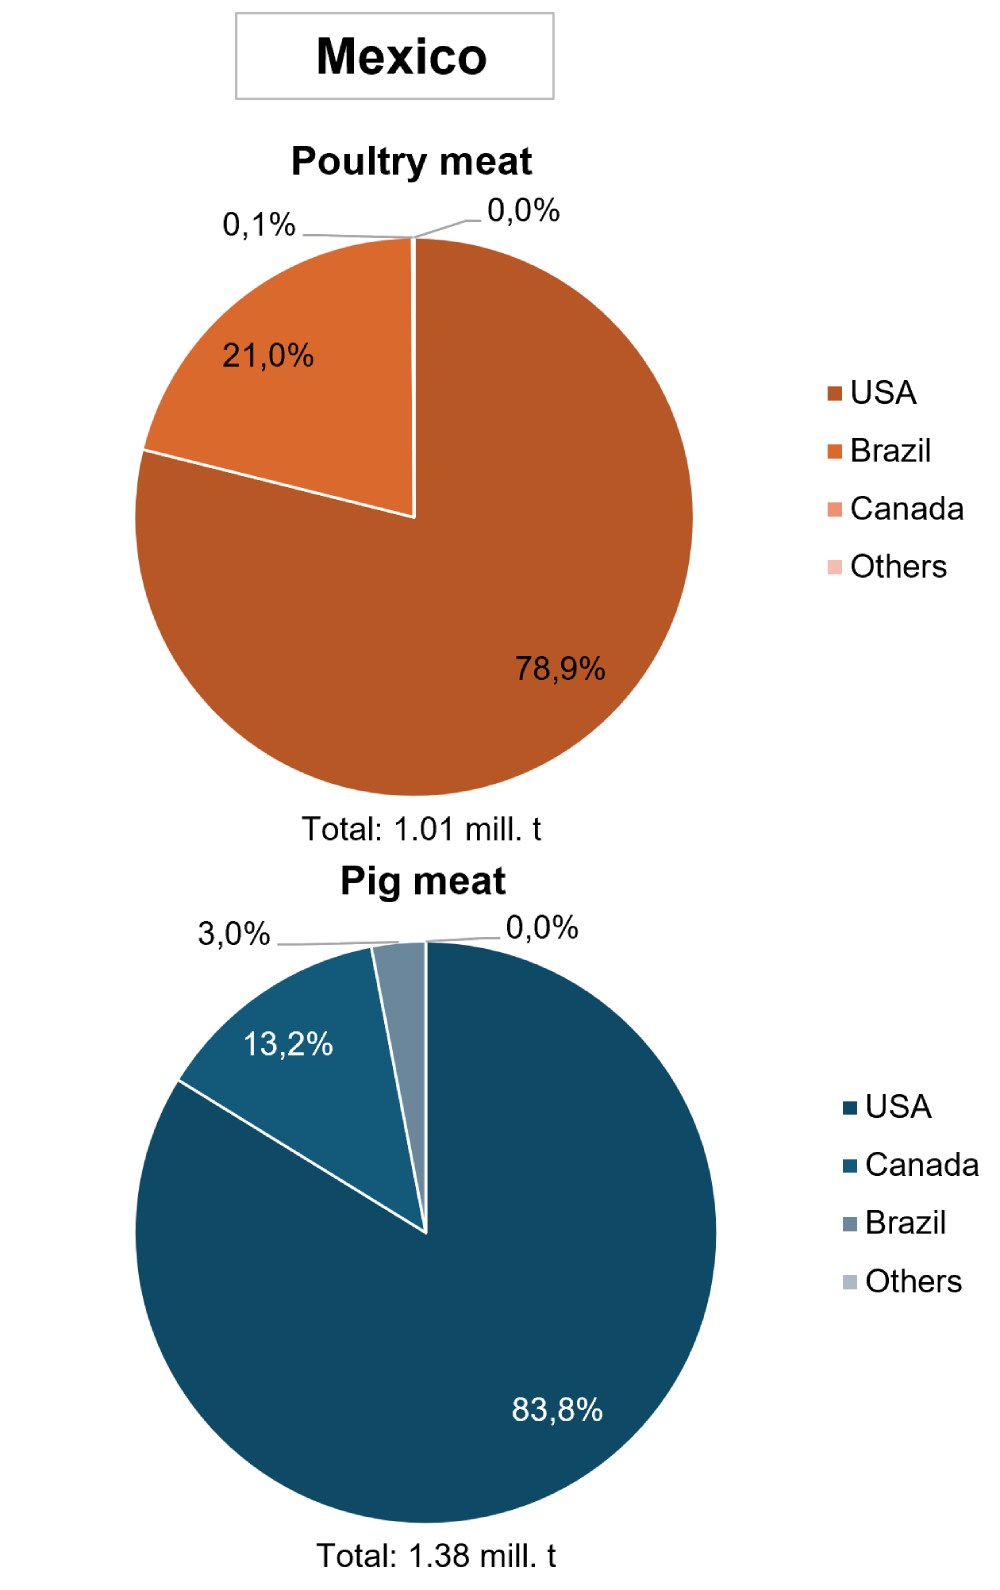
It will now be examined which countries were the most important sources of imports for the four importing countries considered here. Figure 4 shows the four most important countries of origin for each meat type. Clearly, Brazil, the USA, Canada and Australia were the leading countries of origin. It is noteworthy that the USA was represented among both the exporting and importing countries.
Design: A. S.Kauer, based on FAO data.
Of the 3.9 million tonnes of meat imported by China in 2024, 2.1 million tonnes, or 53.8%, came from Brazil, making it the most important supplier for all three meat types. Argentina, Canada and the USA were also significant countries of origin.
Japan imported 2.1 million tonnes of meat, of which 1.6 million tonnes, corresponding to 75.9%, came from G19 countries. Around a quarter of this was chicken meat, imported almost exclusively from Brazil. Pork was mainly sourced from North America, while beef came from Australia and the USA. It is striking that the regional concentration of pork imports was much lower than that of beef and chicken meat. Here, European member countries achieved higher shares.
The majority of Mexico’s meat imports came from the other two partners in the USMCA free trade agreement. Non-member countries had no market share. The United States accounted for 1.95 million tonnes, accounting for 81.8% of the total 2.39 million tonnes of meat imported, while Brazil accounted for 10.6% and Canada for 7.7%. Brazil supplied 253,000 tonnes of chicken and pork, while Canada supplied 183,000 tonnes of pork.
At first sight, it may be surprising that the USA imported 1.5 million tonnes of beef despite its own high domestic production of 12.3 million tonnes; 1.2 million tonnes of which came from four G19 member countries. Australia and Canada accounted for almost two-thirds of this, while Mexico and Brazil together accounted for one-third. A more detailed analysis of the imported products would show that these were mainly valuable cuts.
It should be noted that the majority of meat was imported from a relatively small number of member countries. This is where imports differed from exports. This difference can be attributed to the fact that only a few countries had a large surplus in supply. Apart from Brazil and the USA, these countries were Canada, Australia and Argentina. This also explains why the share of non-member countries in meat imports was lower than in exports.
Summary and outlook
Design: A. S. Kauer, based on FAO data.
The above analysis showed that around one tenth of the meat produced in the G19 countries entered the global market in 2024. As only a few countries had a significant surplus in supply, they largely determined export activities. Brazil and the USA were the dominant players, accounting for 56% of the group’s meat exports. However, only 36% of these exports were destined for other G19 member countries.
The G19 countries imported significantly more meat from other member countries. Non-member countries only achieved comparatively small market shares in the four importing countries considered here. The most receptive markets were China, Mexico and Japan. Depending on the meat type, they imported between 64% and 92% from other G19 countries.
It is reasonable to assume that demand for meat will continue to rise over the next decade, especially in emerging economies. In addition to Brazil and the USA, it is likely that Russia, China and India will expand their production and export more meat despite their rising domestic demand. Recent joint activities by Russia and China in hybrid broiler chicken breeding suggest that they intend to compete for a share of the attractive global market.
Data source and supplementary literature
FAO. (n.d.). FAOSTAT. https://www.fao.org/faostat
Windhorst, H.-W. (2026a, April). The role of the G20 group in global meat production and trade. Part 1: production. Zootecnica Poultry Magazine, 2(4).
Windhorst, H.-W. (2026b, May). The role of the G20 group in global meat production and trade. Part 2: exports. Zootecnica Poultry Magazine, 2(5).
Windhorst, H.-W. (2026c, June). The role of the G20 group in global meat production and trade. Part 3: imports. Zootecnica Poultry Magazine, 2(6).
Footnotes
1 The following analysis considers only the 19 member countries. The population and economic output of the EU (27) and the African Union are not included.
2 The analysis of the poultry meat trade focuses on chicken meat because the FAO does not provide summary export and import data for poultry meat.
See also:
The role of the G20 in global meat production and trade. Part 1: meat production
The role of the G20 group in global meat production and trade. Part 2: global meat exports
The role of the G20 group in global meat production and trade. Part 3: global meat imports