
Between 1993 and 2013, the number of globally produced meat chickens increased by 30.5 billion birds or by 99.1% and reached a volume of 61.2 billion. The highest absolute growth showed the newly industrialised and less developed countries, the highest relative growth the least developed countries.
A large number of scientific papers on the development, dynamics and patterns of egg and meat production in the old industrialised countries have been published so far; however, there are hardly any studies which deal with the role of the less developed and newly industrialised countries in global egg and meat production. In this article the Author will investigate the spatial shifts in chicken meat production.
It will be distinguished between four country development groups (CDG):
– LLDC = Least Developed Countries
– LDC = Less Developed Countries
– NIC = Newly Industrialised Countries or threshold countries
– OIC = Old Industrialised Countries.
Table 1 shows the shares of the four country development groups in world population, global production of meat chickens[2] and of chicken meat in 2013. The data reveal that 32.8% of the world population lived in the least and less 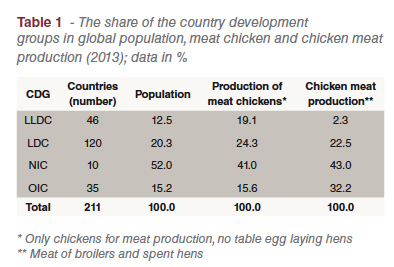 developed countries.
They contributed 43.4% to global meat chicken and 24.8% to global chicken meat production. In the newly industrialised countries 52.0% of the world population was concentrated; they shared 41.0% of the global meat chicken and 43.0% of the chicken meat production. Only 15.2% of the world population lived in the old industrialised countries. Even though they only contributed 15.6% to the world meat chicken production, they shared 32.2% of the global chicken meat production. The data reflects the higher intensity of broiler meat production in the old industrialised countries. The data also shows the imbalance between population and production shares of the least developed and old industrialised countries.
Developments and spatial shifts in meat chicken production
Between 1993 and 2013, the number of produced meat chickens increased from 30.7 billion to 61.2 billion or by 99.1%. The dynamics in the four country development groups differed considerably.
The highest absolute increase showed the newly industrialised countries with 14.9 billion birds, followed by the less developed countries with 9.1 billion. The highest relative growth rate was to be found in the least developed countries with 211.4%.
It is worth mentioning that the old industrialised countries showed a much lower change in the number of produced meat chickens than the less developed and newly industrialised countries. They also had the by far lowest relative growth rate with only 35.4%.
A closer analysis of the contribution of the four country development groups to the increase in meat chicken production reveals that the newly industrialised countries contributed 49.1% and the less developed countries 29.8%, the old industrialised countries16.0% and the least developed countries only 5.1 %. One has to consider, however, that the old industrialised countries already had a comparatively high share in the global production volume in 1993 with 13 billion birds.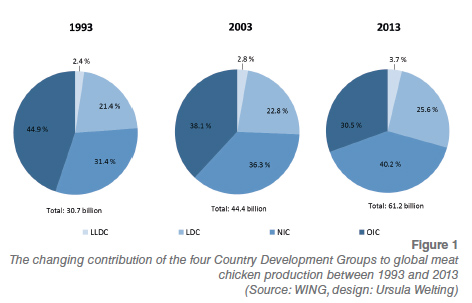
Figure 1 shows the changes in the distribution of the four Country Development Groups to meat chicken production.
Because of the different dynamics, the shares of the four country development groups in global meat chicken production changed considerably in the analysed time period. While the less developed and newly industrialised countries gained shares, the old industrialised countries had to face a sharp decrease of 14.4%.
Developments and spatial shifts in chicken meat production
Between 1993 and 2013, the production volume of chicken meat grew from 41.3 million t to 96.1 million t or by 132.9%. This was by far the highest absolute increase of all meat types. The growth rate was much higher than that of meat chickens which shows on the one hand that the intensity of production increased in the least and less developed countries and reflects on the other hand the considerable growth of the average slaughter weight in the old and in some newly industrialised countries. This development is closely related to the changes in the consumption behaviour.
While whole, deep-frozen broilers lost in importance, the share of cut up and further processed parts has increased constantly, in particular in the old and newly industrialised countries.
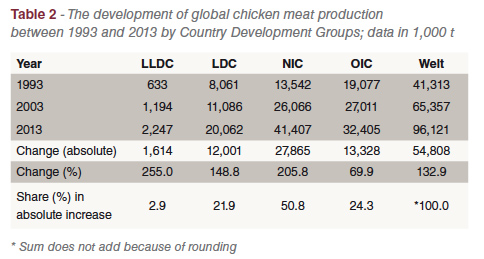 The data in Table 2 reveals considerable differences in the dynamics of chicken meat production in the four Country Development Groups. The least developed countries showed the highest relative growth rate with 255.0% in the analysed time period. The absolute increase of the production volume by only 1.6 million t was the lowest of all groups, however. In contrast, the newly industrialised countries showed the highest absolute growth with 27.9 million t. This reflects the very dynamic population development, the increasing purchasing power of a growing middle class and the important role which chicken meat plays in supplying the population with valuable animal proteins.
The newly industrialised countries contributed 50.8% to the absolute growth of the chicken meat production volume between 1993 and 2013. In the less developed countries, chicken meat production grew by 12.0 million t or 144.8%. Their contribution to the expansion of global chicken meat production reached 21.9%.
The growth of the production volume in the old industrialised countries was much lower than in the newly industrialised countries with only 13.3 million t (+ 69.9%) and also lower than in the combined production of the least and less developed countries. This is also true for their contribution to the global production volume. One has to consider, however, that the per capita consumption in most of the old industrialised countries was already comparatively high in 1993 and that the population dynamics was much lower than in the other three country groups. The global pattern of chicken meat production is documented at country base in Figure 2. 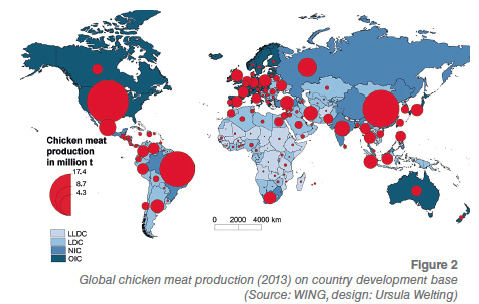
The preceding analysis of the dynamics in global chicken meat production is also reflected in the changing shares of the four Country Development Groups (Figure 3).
With an increase of 10.3 %, the newly industrialised countries were able to considerably expand their share. In contrast, the contribution of the old industrialised countries fell by 12.5%. Despite the considerable growth of their production volume, the less developed countries could only gain an increase of their share by 1.4%, mainly a result of the very dynamic development in the newly industrialised countries. Even though their contribution increased, the share of the least developed countries in global chicken meat production was still very small in 2013 with only 2.3%.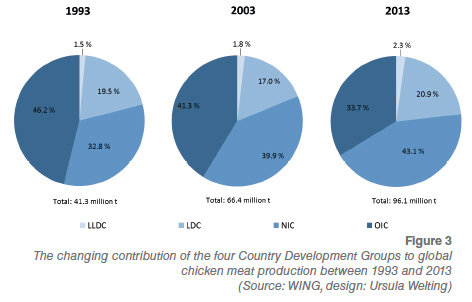
A low per capita income, infrastructure deficits in transportation and trade as well as instable political situations in several countries are the main steering factors behind the stagnation in this sector of animal production.
One can assume that the growth of global chicken meat production will not slow down in the decades to come. The changes in the consumption behaviour in the old industrialised countries and a growing per capita consumption in the newly industrialised and less developed countries will initiate a phase of further growth. One has also to consider that the favourite feed conversion of broilers is an important economic factor in comparison with that of cattle or swine.
The dynamics of chicken meat production at country base
Table 3 shows that chicken meat production in the ten newly industrialised countries increased by 28.3 million t or 217,7 % between 1993 and 2013.
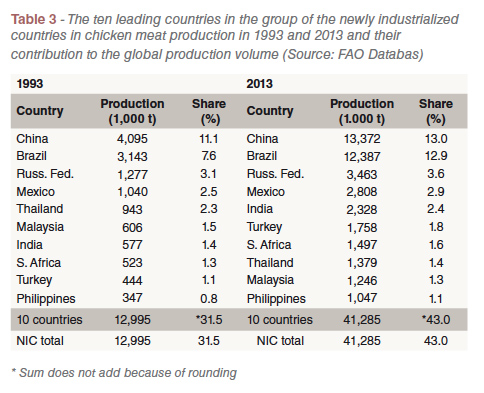 This remarkable dynamics is a result of the production increase in all ten countries. This alone shows the growing importance of chicken meat in the supply of valuable animal proteins for a fast growing population.
In Brazil and China, the production volumes increase by together 18 million t. The Russian Federation follows with a growth of 2.2 million t.
Although the production volume of chicken meat grew by 11.2 million t between 1993 and 2013, which is 20 % of the global increase, the old industrialized countries lost 15.6 % of their share in 1993 (Table 4). 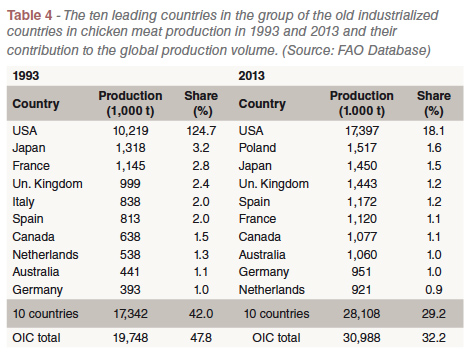 The USA remained in an unchallenged leading position with a production volume of 17.4 million t, a contribution of 18.1 % to global production. Chicken meat production grew by 7.2 million t or 70.2 % during the analyzed time period.
With the exception of Italy which was replaced by Poland, the composition of the leading countries was unchanged. It is, however, worth mentioning that Poland which only produced 260,000 t in 1993, ranked in second place in 2013 with a production of 1.2 million t, a growth of 483.5 %.
In Poland, a very efficient chicken meat industry was developed over the past decade, based to a high degree on foreign investments.
In the less developed countries, chicken meat production increased by 12.0 million t or 148.8 % between 1993 and 2013 (Table 5). 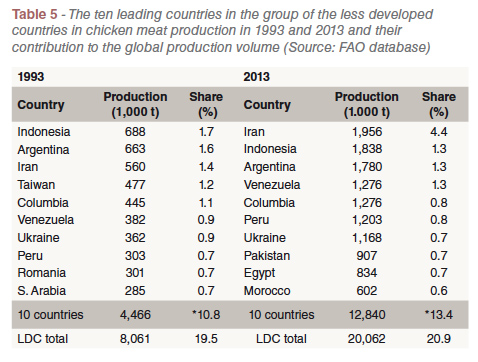 The relative growth rate was considerably higher than that of the old industrialised countries. Of the overall growth in this Country Development Group, 8.4 million t were contributed by the ten leading countries. A remarkable increase in production showed Iran and Indonesia. In these two countries the production volume grew by together 2.4 million t. But also in Argentina, Venezuela, Columbia, Peru and Ukraine growth rates between 800,000 t and 1.2 million t were reached. Seven of the ten leading countries produced more than one million t of chicken meat in 2013, Iran close to 2 million t. This again documents the growing importance of chicken meat in supplying a fast growing population with a high value animal protein. This is especially the case in Islamic countries.
Of the ten leading countries four were located in South America, three in Asia, two in Africa and one in Europe. The ranking of Egypt and Morocco among the leading countries documents the growing importance of chicken meat production in African countries, even though their growth rates are much lower than in South America and Southern Asia.
Chicken meat production in the group of the least developed countries increased by 1.6 million t or 255.0 % between 1993 and 2013 (Table 6). 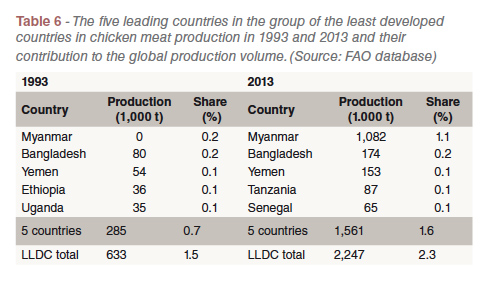 This was the highest relative growth rate of all four Country Development Groups. In Myanmar, the production volume grew by 1 million t, followed by Yemen with 100,000 t and Bangladesh with 94,000 t. In the Islamic countries in Western and Southern Asia a new growth center is under development.
 The preceding analysis could document the considerable growth of global chicken meat production. The lack of religious taboos, the ability to react fast to changes in the market situation because of a short reproduction period and the favourable feed conversion rate in comparison to pig and cattle fattening are the main steering factors behind this dynamics. Regarding the related spatial shifts it is obvious that the newly industrialised and less respectively least developed countries showed much higher growth rates than the old industrialised countries. New growth centres besides South America, where Brazil is in a dominating position, are Western, Southern and Eastern Asia. In the Islamic countries in Northern Africa a new growth centre is under development.
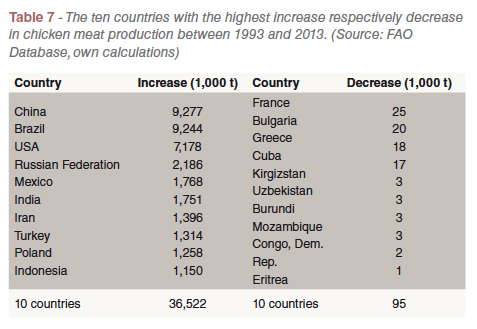
A closer look at the dynamics reveals that Brazil, China and the USA showed the highest absolute growth in chicken meat production. Together the three countries contributed 70 % to the global increase. The Russian Federation, Mexico and India followed in ranks four to six. Worth mentioning is also the remarkable growth of the production volume in Turkey and Indonesia. On the other hand, a decrease of chicken meat production could be observed in France and in several Eastern European, Middle Asian and in African countries.
In the less developed countries, considerable growth rates can also be expected in future while for the old industrialised countries only low growth rates are projected because of the already high per capita consumption and an only moderately growing respectively stagnating or even decreasing population.
A further increase of the production volume in these countries will depend on the possibility to export chicken meat to countries with a strong growth in demand but limited possibilities to increase their domestic production.
References
FAO Data Base: http://faostat3.fao.org
Windhorst, H.-W. (2014): The position of Asia will be strengthened – The remarkable dynamics of global meat production over the past 50 years – a time-spatial analysis. FleischWirtschaft International 29 (4), 17–24.
Windhorst, H.-W.: Die Rolle der Entwicklungs- und Schwellenländer in der Eier- und Fleischerzeugung (= WING Beiträge zur Geflügelwirtschaft Heft 9). Vechta 2015. 59 S.


