
The first paper, in a series of two, which deals with the egg industry in the Group of Nineteen countries between 2006 and 2016 will analyze the role of these countries in a global setting, the development of the laying hen inventories and egg production.
The G20 (Group of Twenty) was founded in 1999 in Berlin as a forum of 19 individual member countries and the EU. Member countries are: Argentina, Australia, Brazil, Canada, China, France, Germany, India, Indonesia, Italy, Japan, the Republic of Korea, Mexico, the Russian Federation, Saudi Arabia, South Africa, Turkey, the United Kingdom, the United States and the European Union.
It substituted the former G8 group. The main goal of the forum is to undertake means which contributes to the stability of the global financial situation. The heads of the G20 countries hold annual summits to discuss financial and trade matters. Conferences of the finance and foreign ministers hold separate meetings.
The composition of the group has been criticized frequently in the past. In this report, 19 instead of 20 countries are analysed. The EU is omitted as four member countries are among the G19 and the author in 2017 already published a detailed study titled “The EU Egg Industry in Transition” for the IEC.
The role of the G19 in a global setting
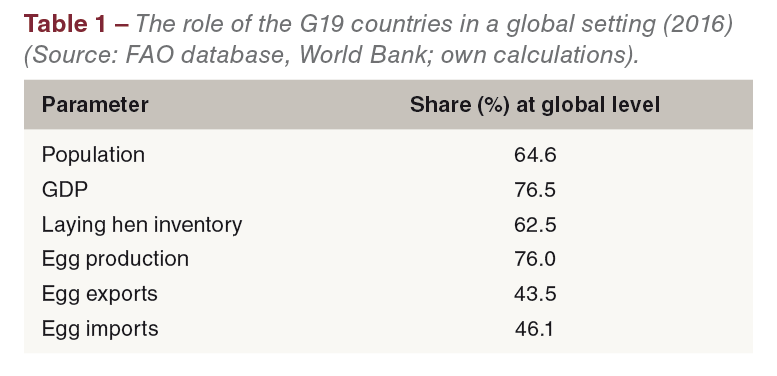 In 2016, the G19 countries shared 64.6% of the global population, 76.5% of the GDP, contributed 62.5% to the global laying hen inventory and 76.0% to global egg production. Their share in global egg trade was much lower. They contributed 43.5% to the global export and 46.1% to the global import volume (Table 1). The difference in their contribution to egg production and egg trade indicates that the efficiency in the egg industry in most of the G19 is very high. In a detailed analysis at country level, dynamics and changes in the spatial patterns of production and trade will be documented.
The development of the laying hen inventories in the G19 countries
 Between 2006 and 2016, the global laying hen inventory increased from, 4.8 billion birds to 6.1 billion birds or by 25.4%. In the same decade, the inventories of the G19 countries grew by 992 mill. hens or by 35.5%. They contributed 80.8% to the global increase.
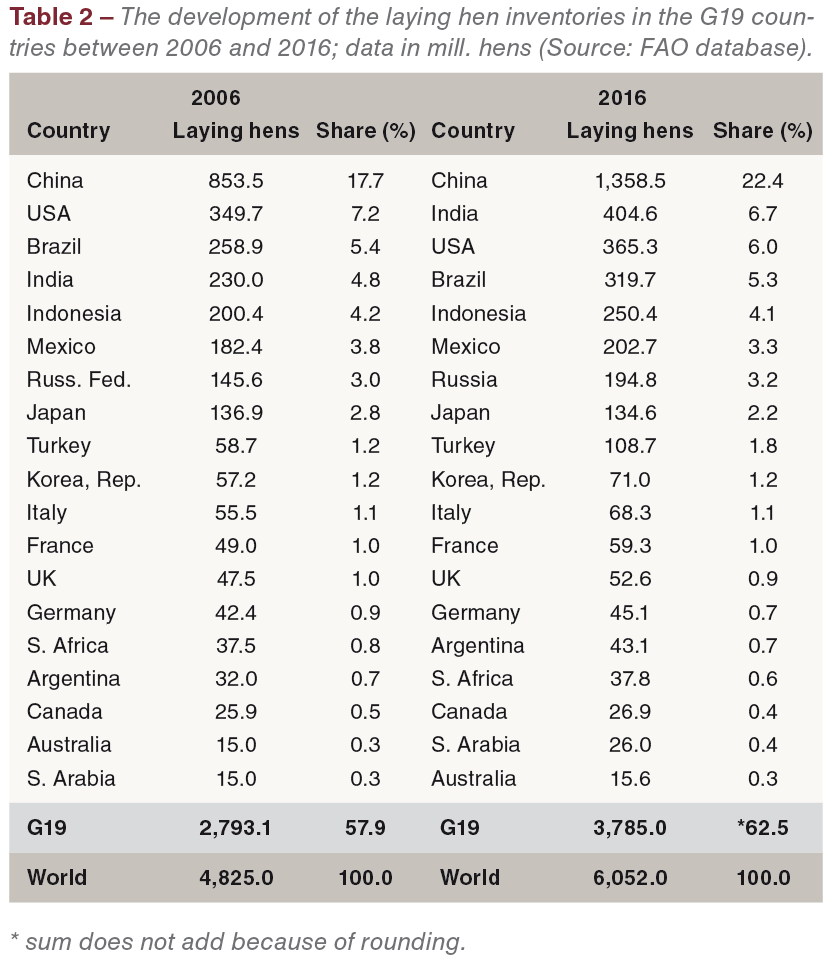
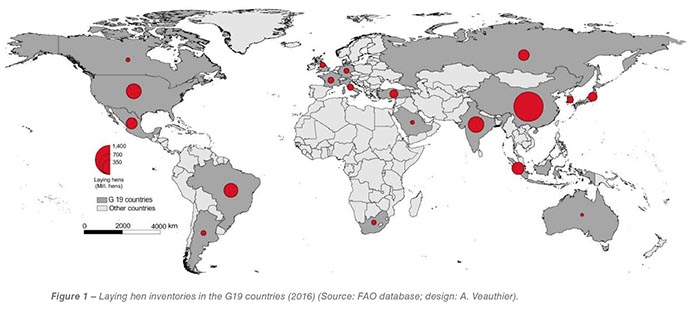
In Table 2, the development of the inventories between 2006 and 2016 at country level is documented. A comparison of the ranking shows some remarkable changes. India moved from rank four to rank two and the USA and Brazil lost one rank. At the lower part of the table, Argentina and Saudi Arabia gained one rank while South Africa and Australia lost one rank. It is obvious that China was able to fasten its 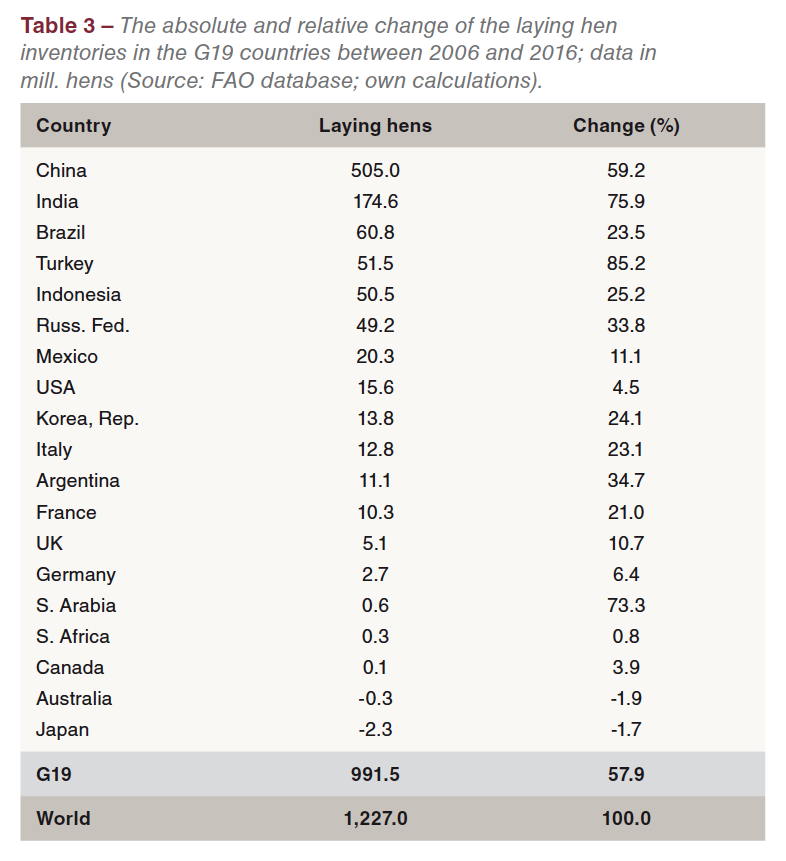 leading position. Remarkable is the fast increase of the inventory in India, resulting from a growth in the per capita consumption and the higher domestic demand. The inventories decreased in Japan and in Australia. The spatial pattern of the laying hen inventories in 2016 is documented in Figure 1.
Table 3 lists the G19 countries according to the absolute change of their inventories. China and India ranked in the first two positions. Together they contributed 55.4% to the global growth and 68.5% to that of the G19 countries. The highest relative growth rate showed Turkey, followed by India and Saudi Arabia. In a latter part of the analysis it will be documented what impacts this had on the trade patterns.
The development of egg production in the G19 countries
 Global egg production grew by 15.9 mill. t between 2006 and 2016 and reached a volume of 73.9 mill. t. In the same time period, egg production in the G19 countries grew from 44.6 mill. t to 56.2 mill. t or by 25.8%. The G19 countries contributed 11. 5 mill. t or 72.3% to the global increase of egg production. The laying hen inventory increased faster than egg production. This indicates that several G19 countries placed more pullets to meet the domestic demand and that the young flocks had not reached their full laying capacity. Another reason could be the use of local breeds with lower laying rates, especially in smaller farms and in backyard flocks.
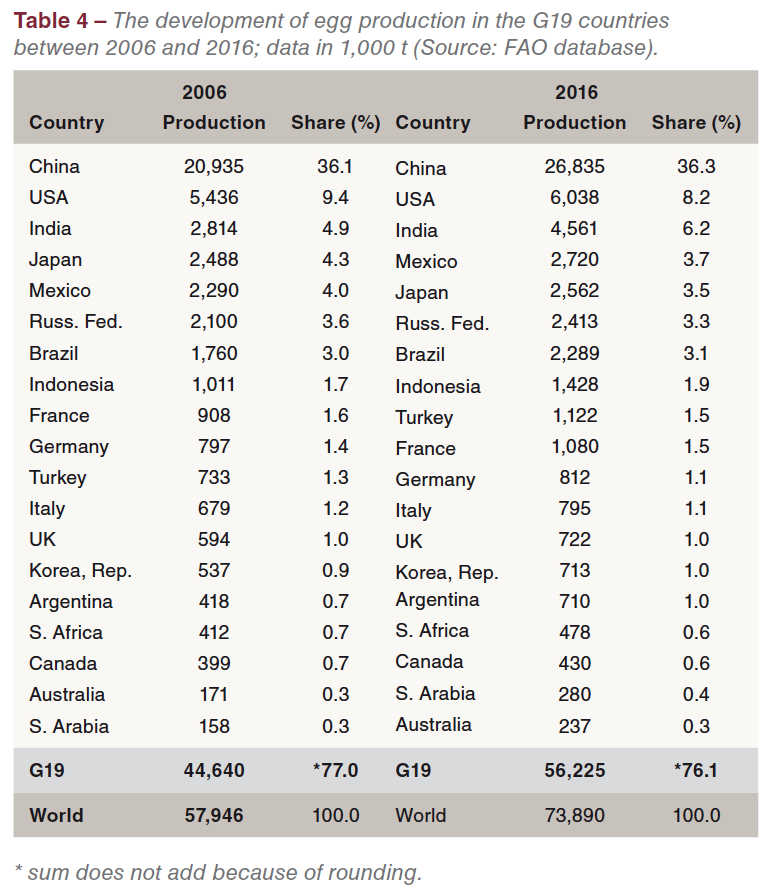
In Table 4, the changes in the ranking and the shares in global egg production are documented. There were no changes in the top three positions. While China gained 0.2% and India 1.3%, the USA lost 1.2% of their contribution to the global production volume. Mexico surpassed Japan and Turkey ranked before France. The change in the ranking partly reflects the dynamics in the laying hen inventories. A comparison of the share of the single countries in the inventories and in production reveals some interesting differences. The USA only contributed 6.0% to the global layer flocks but 8.2% to global egg production. This documents the high intensity of the production systems in that country. Brazil shared 5.3% in the global laying hen inventory but only 3.1% in global egg production. Obviously, the average laying rates of the hens were much lower and still a high percentage of eggs were produced in backyard flocks. The same is true for Indonesia where local breeds were used by many egg farmers. In Turkey, the contribution to the global inventory was also higher than to egg production. This seems to be a result of the fast growth of the inventory and a high percentage of young flocks which had not yet reached their full production capacity. Figure 2 shows the spatial pattern of egg production in the G19 countries in 2016.
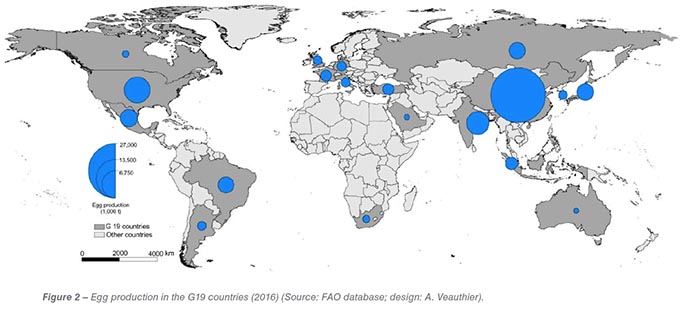
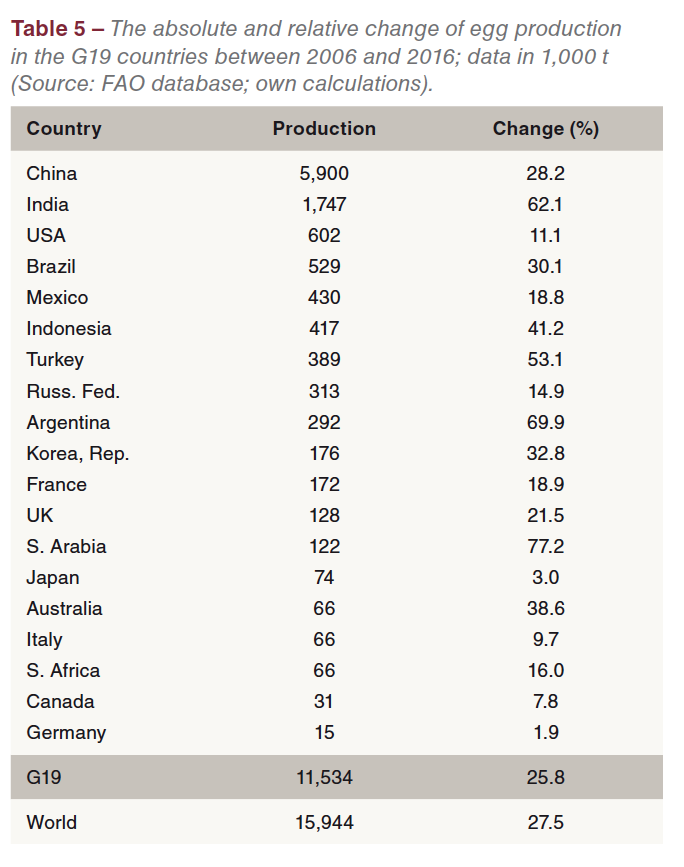 Table 5 lists the G19 countries according to the absolute increase of their egg production in the analysed decade. China ranked in first place with an absolute growth of 5.9 mill t, followed by India, the USA and Brazil. The four countries contributed 55.1% to the global increase of egg production between 2006 and 2016. Even if the absolute growth for China is overestimated, the role of Asia and the Americas in the dynamics of the global egg industry become evident. The highest relative growth rates showed Saudi Arabia, Argentina and India. They were the fastest growing egg producing countries in the decade between 2006 and 2016. While India and Saudi Arabia were focused on supplying the domestic market, Turkey became the second most important egg exporting country behind the Netherland.
Data sources, references and suggestions for further reading
FAO database: http://www.fao.org/faostat.
G20: https://en.wikipedia.org/wiki/G20.
Windhorst, H.-W.: The extraordinary dynamics of the Turkish poultry industry. In: Zootecnica International 37 (2015), no. 9, p. 26-30.
Windhorst, H.-W.: A projection of the future dynamics in global egg production. In: Zootecnica International 40 (2018), no. 7/8, p. 24-26.
Windhorst, H.-W.: China, India, Japan – the three leading countries in Asia’s egg industry. London: International Egg Commission 2018.
Windhorst, H.-W.: Mexico’s egg industry. In: Zootecnica International 40 (2018), no. 3, p. 34-37.
Worldbank: https://data.worldbank.org/.


