
Country Development Groups – a new classification
The classification of the 211 countries for which data sets are available is based on several parameters, i.e. gross national product, personal income, purchasing power, life expectancy, infant mortality etc. The countries were classified in four Country Development Groups (CDG):
LLDC = Least developed countries
LDC = Less developed countries
NIC = Newly industrialised or threshold countries
OIC = Old industrialised countries
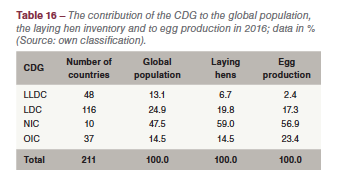 The data in Table 16 reveals the considerable imbalance between the share of the four CDG in global population and egg production. The 164 developing countries shared 38.0% in the global population but only 19.7% in global egg production. On the other hand, the 37 old industrialised countries contributed only 14.5% to the population but shared 23.4% in global egg production. It is worth noting that the 10 threshold countries contributed 47.5% to the global population but 56.9% to global egg production. In the following detailed analysis, the changing roles of the four Country Development Groups in global egg trade between 2006 and 2016 will be documented.
In order to be able to compare the dynamics in production with that in trade it will be necessary to stay in the same classification system. Therefore, a short overview on the development of global egg production at CDG level in the analysed decade will precede the analysis of the trade dynamics.
Newly industrialised countries push dynamics in egg production
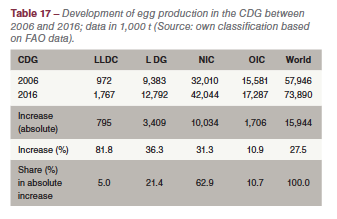 Global egg production grew by 15.9 mill. t or 27.5% between 2006 and 2016. To this growth, the newly industrialised countries contributed 10.0 mill. t or 62.9%, followed by the less developed countries with 21.4% (Table 17). It is worth noting that the old industrialised countries shared only 10.7% in the global increase, about half the amount of the less developed countries. With only 10.9% they also had the lowest relative growth rate.
Old industrialised countries dominated global egg exports and imports
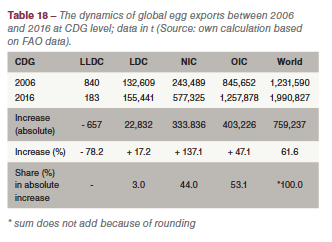 Between 2006 and 2016, global egg exports increased by almost 760,000 t or 61.6%. To this growth, the old industrialised countries contributed over 403,000 t or 53.1%, followed by the newly industrialised countries with almost 334,000 t or 44.0%. The export volume of the less developed countries grew by 22,832 t. Nevertheless, they shared only 3.0% in the global increase (Table 18). The data reveals that most of the old industrialised countries because of their very efficient production were not only able to supply their domestic markets but also to export considerable amounts of shell eggs for consumption. The spatial pattern of global egg exports and imports are documented in Figure 3 and Figure 4, the changing contribution of the four CDG to global egg exports and imports in Figure 5.
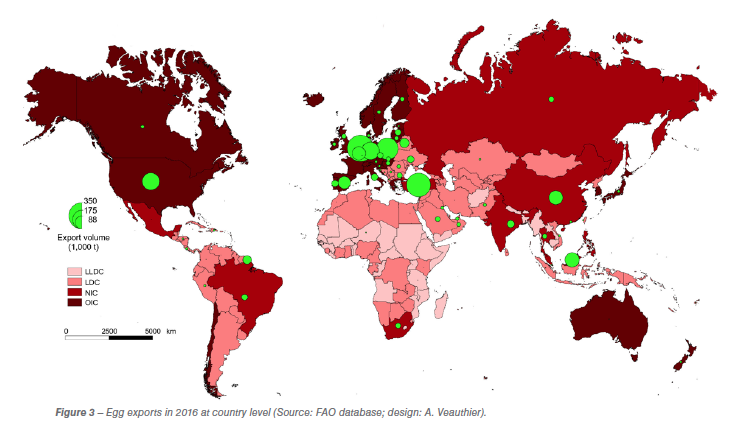
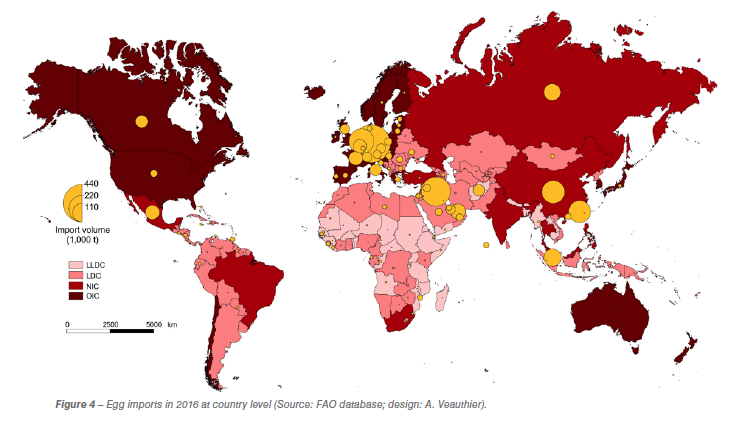
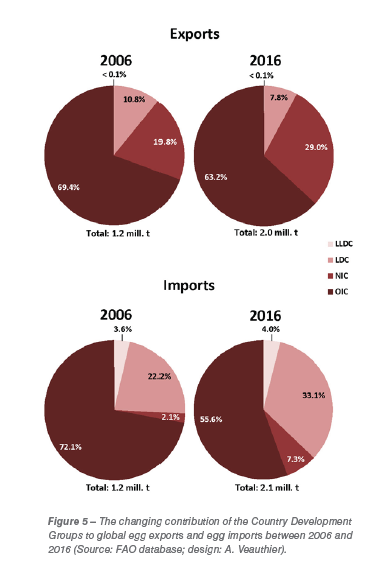 Table19 shows the dynamics of global egg imports between 2006 and 2016. A comparison with the data in Table 19 reveals some remarkable differences. The fact that the values for exports and imports differ is a result of the dates at which the exports respectively imports was documented in the country statistics. In addition, some of the traded eggs were still under way at the end of a fiscal or calendar year.
Egg imports grew faster than exports and reached a volume of over 2.1 mill. t in 2016. Less developed countries contributed almost 431,000 t or 47.8% to the increase of 902,000 t, followed by the old industrialised countries with 301,000 t or 33.4%. Together, the two CDG contributed 81.2% to the increase of global egg imports. The import volume of the least developed countries almost doubled in the analysed time period. Together, the developing countries shared 52.4% in the global increase. In contrast to egg exports, the newly industrialised countries contributed only 14.2% to the global 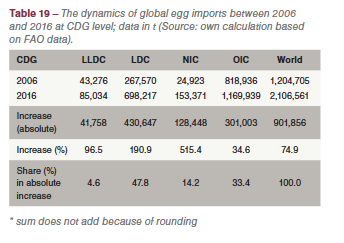 growth. The changing contribution of the four CDG to global egg imports between 2006 and 2016 is documented in Figure 5. While the old industrialised countries lost 16.5% of their former share, the less developed countries gained 9.9%, the newly industrialised countries 5.2% and even the least developed countries 0.4%.
A comparison of the export and import shares of the CDG reveals some interesting patterns. While the newly industrialised countries dominated in production, followed by the old industrialised countries, the latter ranked in first place in egg exports, followed by the newly industrialised countries. The growing egg demand in several less developed countries resulted in the sharp increase of their egg imports. The highest relative growth rate was reached in the newly industrialised countries, indicating that despite the remarkable increase of their egg production, imports were necessary to meet the even faster growing demand.
High regional concentration in egg exports and imports in the old industrialised countries
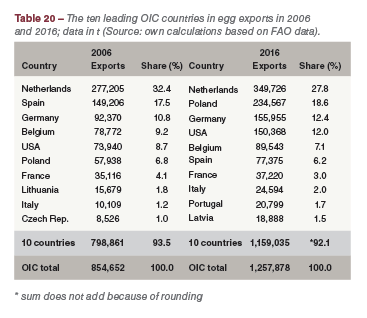 From the data in Tables 20 and 21 it becomes obvious that the dominance of the old industrialised countries in global egg trade is a result of the high regional concentration in exports as well as in imports. In 2016, the three leading exporting countries shared 58.8% of the total export volume of this group and the two leading countries even 54.0% of the import volume. It is not surprising that the Netherlands ranked in first place over the whole time period. It is remarkable, however, that the export volume of Poland more than quadrupled and that of the USA more than doubled.
 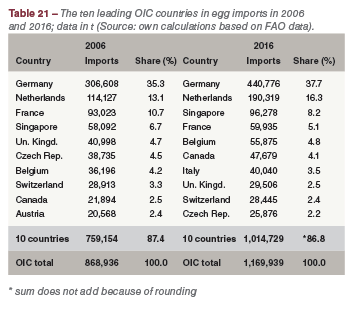 On the other hand, the export volume of Spain fell by 48.2%. Of the ten leading importing countries seven were EU member countries. While Germany, the Netherlands, Singapore and Italy increased their imports considerably, France, the Czech Republic and the United Kingdom imported between 28.0% and 35.6% less in 2016 than in 2006.
Remarkable growth of egg exports and imports by the newly industrialised countries
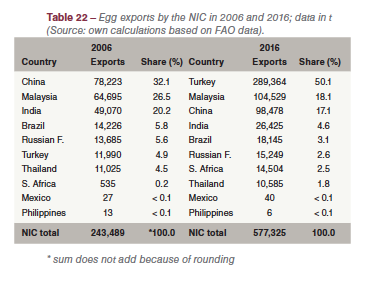 Egg exports by the newly industrialised countries increased by 333,836 t or 137.1%. From Table 22 one can see that the growth was mainly a result of the remarkable increase of Turkey´s export volume. It was more than 25 times higher in 2016 than in 2006 and reached a volume of over 289,000 t. This sharp increase made Turkey the second most important egg exporting country behind the Netherlands. Besides Turkey, Malaysia and South Africa were able to expand their exports considerably. Malaysia was focused on Singapore.
 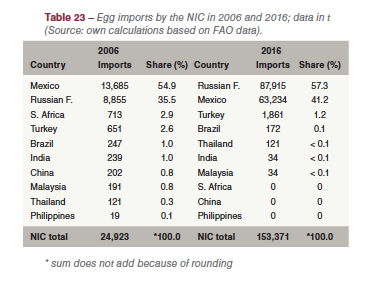 In contrast, India’s exports decreased by 22,645 t or 46.1%. This was mainly a consequence of the fast growing per capita consumption.
Egg imports of the ten newly industrialised countries also grew considerably in the analysed decade. Imports increased by 128,448 t or 515.4%, a result of the development in the Russian Federation and Mexico (Table 23). Russia’s imports were almost ten times higher in 2016 than in 2006, Mexico’s imports about four times higher. The sharp increase in Russia is a result of the fast growing per capita consumption; in Mexico, the Avian Influenza outbreaks made higher imports necessary.
A comparison of the dynamics in egg production and egg trade in this Country Development Group reveals that the relative growth rates in egg trade were much higher than in production. Nevertheless, only 1.4% of the production was exported. But it also reflects the increasing efficiency of egg production in most of the newly industrialised countries.
Imports by less developed countries increased ten times faster than exports
 While egg exports by the less developed countries increased by only 22,832 t or 17.2%, imports grew by 430,647 t or 182.0%. This reflects the fast growing demand in this Country Development Group which in many countries could not be met by domestic production.
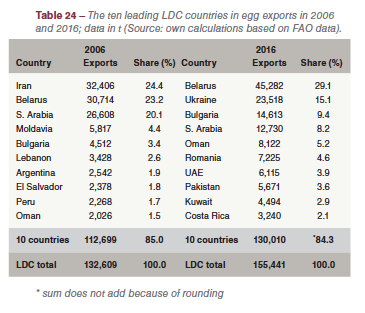
A comparison of the composition and ranking of the ten leading egg exporting countries shows that in 2016 Eastern European countries ranked in the first three places, sharing together 53.6% of the total export volume (Table 24). Ukraine only played a minor role in egg exports in 2006, but ranked in second place behind Belarus a decade later. Its exports were almost twenty-one times higher in 2016 than in 2006. It might have been even much higher because of the very efficient production of one large vertically integrated company, but the political instability and the civil war in the eastern part of the country interrupted the growth.
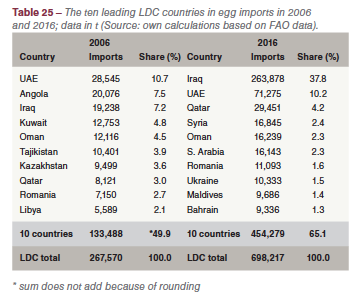 About 70% of the import growth of the less developed countries between 2006 and 2016 was contributed by Iraq, the United Arab Emirates and Qatar (Table 25). Egg imports by Iraq increased by 244,640 t or 1,271.6%. The lasting war and the almost complete destruction of the egg industry made higher imports necessary to meet the demand. There is no data available on the percentage of the imports which really reached the civil population. A similar situation exists in Syria. The growing import volumes of the countries on the Arabian Peninsula reflect the increasing per capita consumption. As all feed for an intensive egg production has to be imported, an expansion of the domestic production is limited. In addition, high disease risks, the lack of qualified personnel and an efficient veterinary system are challenges for egg production in these countries.
Low development status causes only limited access to imports for the least developed countries
 About 13% of the global population lives in the 48 least developed countries. As expected, they are not able to export eggs and because of their low development status only have limited access to egg imports.
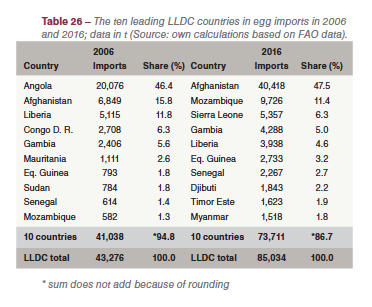
Egg exports are almost not existent and even decreased in the analysed time period. Seven of the ten leading egg importing countries in 2016 were located in Africa and three in Asia. Afghanistan ranked in first place with a share of 47.5 % of the total import volume of the Country Development Group, followed by Mozambique and Sierra Leone (Table 26). As was the case in Iraq and Syria, the military conflicts in Afghanistan and several African countries had severe impacts on their domestic egg production.
The main results of Part 3 can be summarised as follows:
- The dynamics of global egg trade between 2006 and 2016 are analysed at the level of Country Development Groups (CDG).
- In 2016, the OIC shared 63.2% in global egg exports and 55.0% in global egg imports.
- The ten NIC contributed 29.0% to egg exports but shared only 7.3% in egg imports. The much lower import share reflects the growing efficiency of the egg industry in these countries.
- The group of the LDC contributed only 7.8% to global egg exports, but shared 33.1% of the egg imports.
- As was to be expected, the 48 LLDC were hardly able to export eggs, but almost doubled their import volume because of the increasing demand but only minor progress in domestic production.
- As a general statement it can be noted that many OIC and several NIC were able to export eggs because of their highly efficient egg industries while most of the LDC and LLDC could not meet their demand by domestic production and therefore had to import large amounts of eggs.


