
In contrast to trade with shell eggs, which is dominated by the EU, the share of EU member countries in global poultry meat trade is much lower. About 8% to 9% of the global exports are contributed by the EU and between 4% and 5% of the imports are shared by EU member countries. The reason for the much lower share is as well the dominating role of Brazil and the USA in poultry meat exports and the high production volume in the EU. In this paper the patterns of trade will be analysed in detail for the year 2016.
Patterns of poultry meat trade with non-EU countries
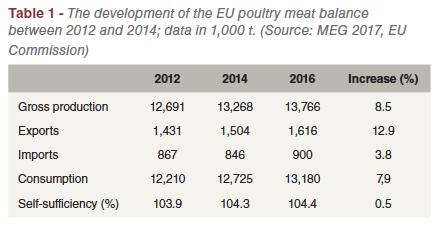 The data in Table 1 shows that poultry meat exports increased faster than imports between 2012 and 2016, due to the fact that production grew faster than consumption. While exports increased by 185,000 t, imports only grew by 33,000 t. The result was that the self-sufficiency rate increased moderately by 0.5%. In Tables 2 and 3 the trade relations with non-EU countries are documented.
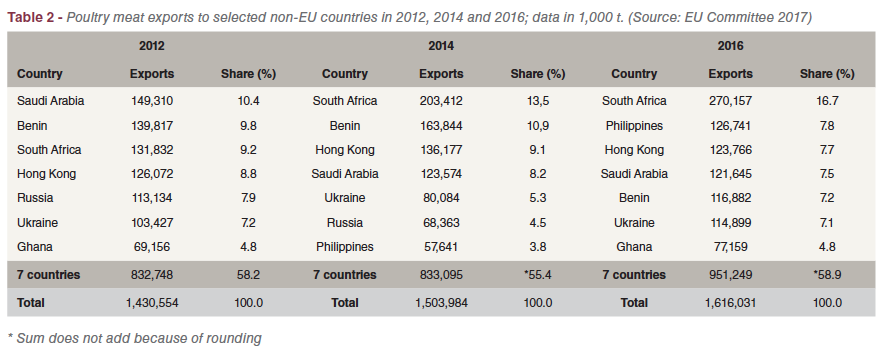
Table 2 shows that the export volume increased by almost 185,500 t between 2012 and 2016 despite the banning of imports by Russia. The exports to the seven leading countries of destination grew by 120,000 t. A closer look at the ranking reveals some interesting changes. In 2012, Saudi Arabia, Benin and South Arica ranked in the first three positions, sharing 29,4% of the total export volume.
In 2014, South Africa, Benin and Hong Kong held these three positions, contributing 33.5% to the overall poultry meat exports. Saudi Arabia only ranked in fourth place. In 2016, the composition and ranking changed again. South Africa was still in first place, followed by the Philippines and Hong Kong. The import volumes of South Africa, the Philippines and Ukraine increased considerably in comparison to 2014, Russia was replaced by Ghana. The composition of the main countries of destination documents that exports are focused on Africa, Western and Eastern Asia and Eastern Europe. The high export volumes to Africa are often criticized with the argument that they impede the development of a domestic poultry industry in these countries because of the low prices of the exported products.
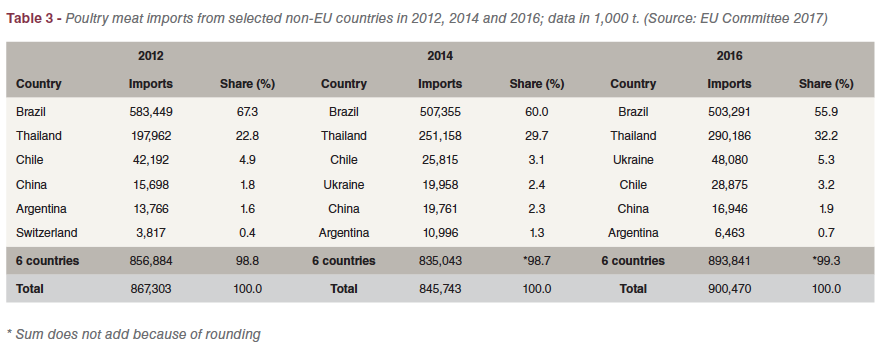 Table 3 documents that poultry meat was mainly imported from only six countries with Brazil and Thailand in a dominating position. In 2016, the two countries shared 88.1% in the total import volume. It is worth mentioning that the USA, the second most poultry meat exporting country on a global scale, is not permitted to export any poultry meat to the EU because of the chlorine treatment of the meat. If this ban would be lifted, the USA would definitely become one of the leading countries of origin. Between 2012 and 2016, the import volume increased by 33,000 t or by 3.8%. The data differs from that in Table 1 because of a different source.
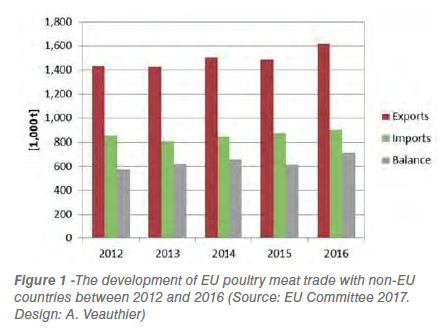 A closer look at the composition and ranking reveals some interesting changes. Brazil was in a top position over the whole time period but lost 11.4% of its share; the import volume decreased by almost 80,000 t. In contrast, Thailand´s export into the EU grew by 92,200 t. This was possible despite frequent AI outbreaks because exports changed to cooked meat. Ukraine became one of the major countries of origin from 2014 on and ranked in third position in 2016. Argentina lost almost half of its export volume into the EU, while imports from China and Chile remained fairly stable. Figure 1 shows the positive development of the trade balance. The trade surplus increased from 563,250 t in 2012 to 725,560 t in 2016.
Patterns of EU poultry meat trade at country level
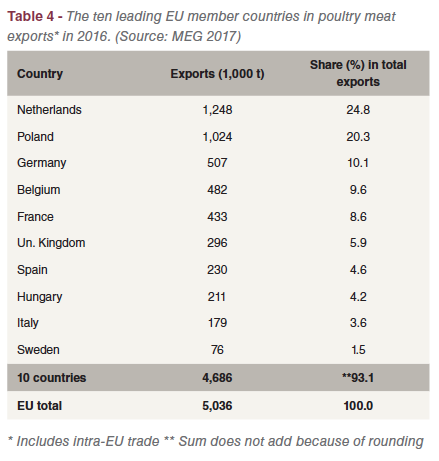 In a second step poultry meat exports and imports by EU member countries will be analysed in detail. Trade date at this level include intra-EU trade. The data in Table 4 shows that poultry meat exports were highly concentrated in 2016. The two leading countries, the Netherlands and Poland, shared 45.1% of the total export volume. Germany, Belgium and France followed in ranks three to five. The then leading countries contributed 93.1% to the EU poultry meat exports. Most of the exports were destined at other EU member countries; only 1.6 mill. t or 32.1 % to non-EU countries (see also Table 2). In 2016, EU member countries imported 3.4 mill. t of poultry meat. This includes the intra-EU trade. Most of the imports originated from other EU member countries, for only 900,000 t were imported from non-EU countries (see also Table 3). The imports are also highly concentrated.
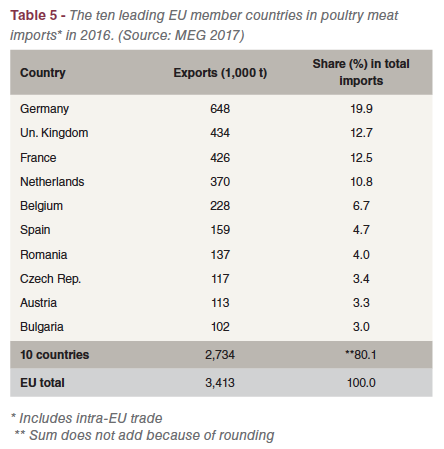 The four leading countries shared 55.9% IN the total import volume, Germany alone 19.9%. The regional concentration in 2016 was lower than in exports, for the ten leading countries shared only 80.1% in the overall imports compared to 93.1% in exports. This documents that in contrast to exports which are concentrated on a few countries with a high surplus, imports are more evenly distributed although also in imports the volumes reflect the population with the exception of the Netherlands. It is expected that between 2017 and 2025 consumption of poultry meat will grow faster than production. While the production volume is projected to increase by about 500,000 t, consumption is expected to grow by 1 mill. t, due to the increase of the per capita consumption from 23.8 kg in 2017 to 24.9 kg in 2025. This will result in higher import volumes.
Conclusion
Poultry meat production in the EU has increased constantly over the past years. This is mainly a result of the high absolute and relative growth rates of broiler meat. Turkey meat production has grown much slower and seems to have reached a level which cannot be surpassed in the coming years. This is a result of the stagnating per capita consumption, while that of broiler meat has grown considerably in the analysed time period. Despite the considerable growth in per capita broiler meat consumption in the past, much slower growth rates are projected for the coming decade, resulting from a stagnating or even decreasing total meat consumption.
Poultry meat exports increased faster than imports between 2012 and 2016, due to the fact that production grew faster than consumption. The composition of the main countries of destination documents that EU poultry meat exports were focused on Africa, Western and Eastern Asia and Eastern Europe.
Poultry meat was mainly imported from only six countries with Brazil and Thailand in a dominating position. In 2016, the two countries shared 88.1% in the total import volume. Poultry meat exports of EU member countries were highly concentrated in 2016 when including the intra-EU trade. The then leading countries contributed 93.1% to the overall EU poultry meat export volume. In 2016, the regional concentration in poultry meat imports was lower than in exports. This documents that in contrast to exports which were concentrated on a few countries with a high surplus, imports were more evenly distributed among the member countries. The EU Commission projects that between 2017 and 2025 consumption of poultry meat will grow faster than production. This will result in higher import volumes.
References and additional literature
Committee for the Common Organisation of the Agricultural Markets (Ed.): EU Market Situation for Poultry. Brussels, August 24th, 2017.
https://circabc.europa.eu/sd/a/cdd4ea97-73c6-4dce-9b01-ec4fdf4027f9/24.08.2017-Poultry.pptfinal.pdf
MEG-Marktbilanz: Eier und Geflügel 2016. Stuttgart 2016.
MEG-Marktbilanz: Eier und Geflügel 2017. Stuttgart 2017.
Windhorst, H.-W.: Spatial shifts in global chicken meat production between 1993 and 2013. In: Zootecnica International 38 (2016), Nr. 11, S. 14-21.
Windhorst, H.-W.: The projected development of global meat production until 2024. Part 1: Poultry meat: Poultry continues with triumphant success. In: Fleischwirtschaft International 31 (2016), Nr. 3, S. 30-34.


