

Between 2016 and 2020, global egg trade showed a remarkable dynamics. In 2018, 2.36 mill. t of shell eggs were exported, 2.97% of the global production. This was the second highest export volume in the past decade. Until 2020, exports decreased by more than 275,000 t or 11.7% and reached a volume of only 2.08 mill. t. In a first paper, the dynamics of egg production and egg trade at the global level was documented. In this paper, the trade flows of exports and imports for selected countries will be analysed.
Hans-Wilhelm Windhorst – The author is Prof. emeritus of the University of Vechta and visiting professor at the University of Veterinary Medicine, Hannover, Germany
Patterns of trade flows in shell egg exports
As was documented in the first paper, the regional concentration of shell egg exports at country level was high, for only ten countries contributed 79.0% to the total global export volume. A closer look at the trade flows of the leading exporting countries reveals different patterns. One can distinguish between countries, which concentrate their exports on a small numbers of destinations, while others export to a much larger number of countries.
Examples for the group with a high regional concentration of their exports are the Netherlands and Malaysia. Figure 1 shows that both countries exported over 90% of their shell eggs to only five countries. 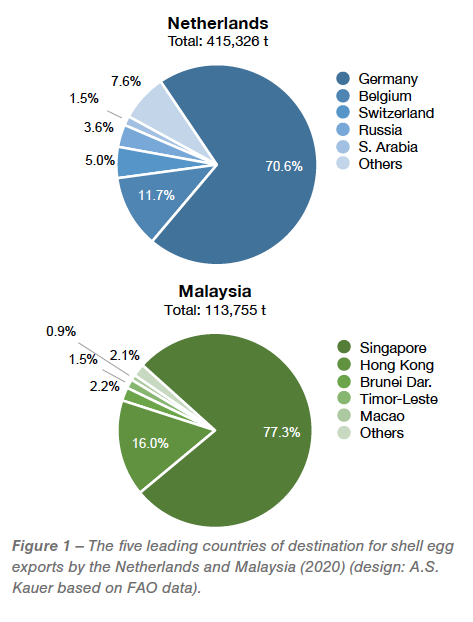 One country of destination (Germany respectively Singapore) was in an unchallenged top position. It is obvious that the short distance between the exporting respectively importing countries played an important role in the pattern of the trade flows. With increasing distance, the export volumes decreased considerably. While Germany’s self-sufficiency rate for egg demand was about 70%, it was almost zero for Singapore. Because of the limited available space for barns and the problems of manure disposal, Singapore decided to give up animal production. Completely depending on imports, the government decided to invest in the development and production of alternative proteins to reduce the dependency.
Examples for the group of a low regional concentration of their exports are Poland and Spain. Both countries increased their exports considerably over the past decade and rank as number three respectively six among the leading egg exporting countries.
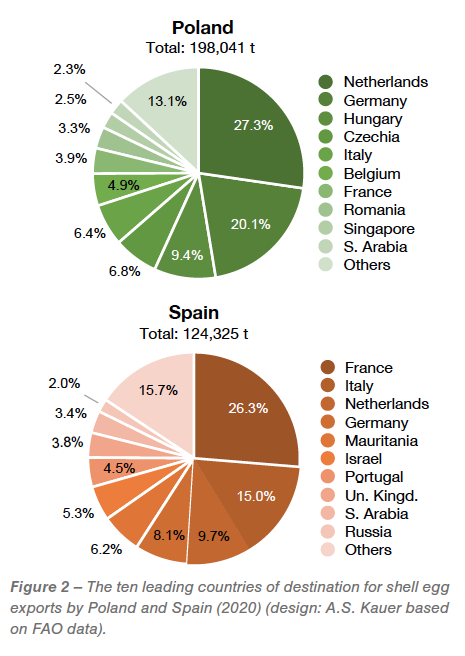 Figure 2 documents the much lower regional concentration in their trade flow patterns. Both countries focused their on EU member countries. The flow pattern of Poland’s exports reflects the former trade relations between CMEA (Council of Mutual Economic Assistance) countries. After joining the EU, Poland began to turn to the attractive markets in Central Europe. Spain’s egg exports fluctuated considerably over the past two decades. A first peak was reached in 2006 with over 149,000 t. A phase with decreasing exports followed until 2011, when the export volume was as low as 54,000 t because of the banning of cages. With the completion of the transformation of the housing systems for laying hens, exports increased again and reached over 124,000 t in 2020. Despite the similarity in the basic trade patterns, it is obvious that Poland’s main interest was the Central European market while Spain focused on Western and Southern European countries.
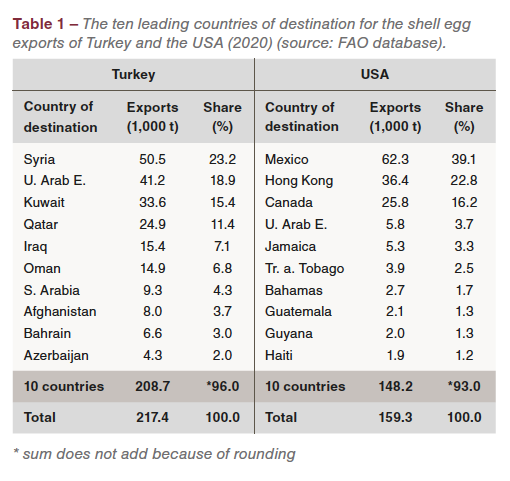 Two countries with a mixed regional pattern of their exports are Turkey and the USA. Both countries exported over 90% to only ten countries, but in comparison to the Netherlands and Malaysia, there was no dominating country of destination, even though four respectively three countries received the largest share (Table 1). It is worth noting that the composition of their destinations differed considerably. Turkey’s ten leading export markets were all Islamic countries. The free trade within USMCA (former NAFTA) played an important role for the USA; 55.2% of the overall exports were directed to Mexico and Canada. As direct imports to China were no longer possible because of the political tensions between the two countries, exports were aimed at Hong Kong as a transfer market. Obviously, countries in Central and South America gained in importance even though the traded volumes were low in comparison to the exports to Mexico and Canada.
Patterns of trade flows in shell egg imports
In a next step, patterns of trade flows in egg imports will be analysed. Here, too, the regional patterns differ considerably.
An extreme regional concentration of their imports showed Mexico and Syria. Mexico imported 98.5% from the USA and Syria even 99.7% from Turkey. Both countries are presently completely dependent on these trade relations. While Mexico might be able to import higher volumes from Brazil, Syria would have to look for other sources in Europe.
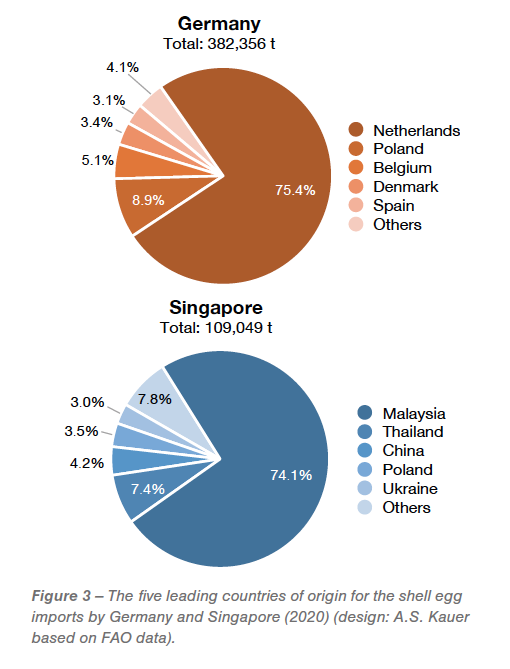 Similar to the flow patterns in exports, one can distinguish between two groups in imports. Examples for a high regional concentration regarding the countries of origin are Germany and Singapore. Figure 3 shows that they imported over 90% of their shell eggs from only five countries. One country of origin was in an unchallenged top position (Netherlands for Germany and Malaysia for Singapore). Germany imported eggs almost exclusively from EU member countries. It is obvious that spatial distance as well as free trade played an important role. The four leading countries were adjacent to Germany and allowed short transportation distances transport time. Distance also determined the flow pattern of Singapore’s imports, as can be seen from the dominating rank of Malaysia, followed by Thailand.
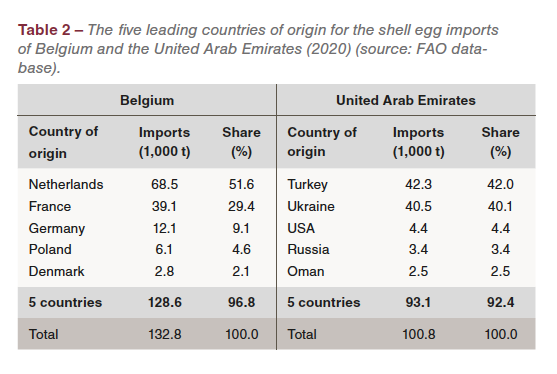 Two countries with a high regional concentration of their imports in 2020 were also Belgium and the United Arab Emirates. Table 2 shows that both countries imported over 80% of their shell eggs from only two countries. Distance was obviously the main steering factor behind Belgium’s imports from the Netherlands and France. For the United Arab Emirates, the closest countries with a high egg surplus were Turkey and Ukraine. Despite the considerable distance, it was possible to transport the eggs by truck.
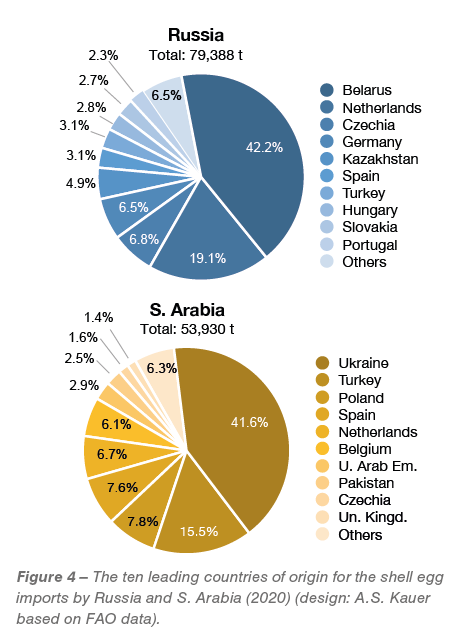 Examples for a lower regional concentration in the flow patterns of their imports are Russia and Saudi Arabia. Both countries imported eggs from a large number of countries (Figure 4), two countries however had the highest share, Belarus and the Netherlands for Russia, Ukraine and Turkey for Saudi Arabia. A closer look at the trade flows for Russia reveals that former trade relations within CMEA were still present, as six of the leading countries of origin belonged to the former council. Because of political tensions, Poland no longer exported eggs to Russia.
The regional concentration of Saudi Arabia’s imports was higher than that of Russia, the ten leading countries of origin contributed 93.7% to the overall imports. Similar to the import pattern of the United Arab Emirates, the majority of the shell eggs were imported from Ukraine and Turkey, the closest countries with a high egg surplus over their domestic demand. Eggs were also imported from the leading egg exporting EU member countries, Poland, Spain and the Netherlands.
Obviously, the strategy of both countries was to avoid a dependency on only one country and to reach supply security by importing eggs from various countries. It is worth noting that because of the political tensions Ukraine did not export eggs to Russia. There is no information available however regarding the large production units in the eastern parts of Ukraine, which are controlled by Russia. Perhaps they are still producing and eggs are shipped to Russia.
Summary
Despite the fact that only a comparatively low percentage of the produced eggs was traded, the economic importance of exports and imports must not be underestimated. For many egg farmers the possibility to export eggs is securing their profitability and for many countries, imports are necessary to close the gap between demand and domestic production.
The paper documents the trade flows for selected egg exporting and egg importing countries. In exports as well as in imports, two trade flow patterns can be distinguished. One group of countries only exports to or imports from only a small number of countries. The regional concentration of trade flows is very high. A second group, either exports to or imports from a larger number of countries. The regional concentration of their trade flows is much lower. Obviously, their strategy is to avoid a dependency on only one or two countries and to secure either the export of their egg surplus or the egg supply in case of a gap between demand and production.
Data source
FAO database: https://www.fao.org/faostat/en.


